
| UNITED STATES SECURITIES AND EXCHANGE COMMISSION Washington, D.C. 20549 |
| FORM 10-K |
|
☒ ANNUAL
REPORT PURSUANT TO SECTION 13 OR 15(d) OF THE SECURITIES EXCHANGE ACT OF 1934 ☐ TRANSITION
REPORT PURSUANT TO SECTION 13 OR 15(d) OF THE SECURITIES EXCHANGE ACT OF 1934 Commission file number 001-37973 |
|
NI HOLDINGS, INC. (Exact name of registrant as specified in its charter) |
|
NORTH DAKOTA
|
81-2683619
|
| 1101 First Avenue North Fargo, North Dakota (Address of principal executive offices) |
58102 (Zip Code) |
(701) 298-4200
Registrant’s telephone number, including area code
Securities registered pursuant to Section 12(b) of the Act:
| Common Stock, $0.01 par value per share (Title of each class) |
NASDAQ Capital Market (Name of each exchange on which registered) |
Securities registered pursuant to Section 12(g) of the Act: NONE
Indicate by check mark if the registrant is a well-known seasoned issuer, as defined in Rule 405 of the Securities Act. ☐ Yes No ☒
Indicate by check mark if the registrant is not required to file reports pursuant to Section 13 or Section 15(d) of the Act. ☐ Yes No ☒
Indicate by check mark whether the registrant (1) has filed all reports required to be filed by Section 13 or 15(d) of the Securities Exchange Act of 1934 during the preceding 12 months (or for such shorter period that the registrant was required to file such reports), and (2) has been subject to such filing requirements for the past 90 days. ☒ Yes No☐
Indicate by check mark whether the registrant has submitted electronically every Interactive Data File required to be submitted pursuant to Rule 405 of Regulation S-T (§232.405 of the Securities Act) during the preceding 12 months (or for such shorter period that the registrant was required to submit such files). ☒ Yes No ☐
Indicate by check mark if disclosure of delinquent filers pursuant to item 405 of Regulation S-K is not contained herein, and will not be contained, to the best of registrant’s knowledge, in definitive proxy or information statements incorporated by reference in Part III of this Form 10-K or any amendment to this Form 10-K. ☐
Indicate by checkmark whether the registrant is a large accelerated filer, an accelerated filer, a non-accelerated filer, a smaller reporting company, or an emerging growth company. See the definitions of “large accelerated filer”, “accelerated filer”, “smaller reporting company”, and “emerging growth company” in Rule 12b-2 of the Exchange Act.
| Large accelerated filer | ☐ | |
| Accelerated filer | ☒ | |
| Non-accelerated filer | ☐ | |
| Smaller reporting company | ☒ | |
| Emerging growth company | ☒ |
If an emerging growth company, indicate by check mark if the registrant has elected not to use the extended transition period for complying with any new or revised financial accounting standards provided pursuant to Section 13(a) of the Exchange Act. ☐
Indicate by checkmark whether the registrant is a shell company (as defined in Rule 12b-2 of the Exchange Act). ☐ Yes No ☒
Based on the closing sales price of the Class A common stock on NASDAQ on June 29, 2018, the last business day of the Registrant’s second fiscal quarter, the aggregate market value of the voting stock held by non-affiliates of the Registrant was approximately $163 million. All executive officers and directors of the Registrant, and all stockholders holding more than 10% of the Registrant’s outstanding voting stock (other than institutional investors, such as registered investment companies, eligible to file beneficial ownership reports on Schedule 13G), have been deemed, solely for the purpose of the foregoing calculation, to be “affiliates” of the Registrant.
The number of the Registrant’s common shares outstanding on March 13, 2019 was 22,209,599. No preferred shares are issued or outstanding.
Documents incorporated
by Reference
Portions of the definitive proxy statement relating to the annual meeting of shareholders to be held May 21, 2019 are incorporated
by reference into Part III of this report.
Page
i
Unless the context otherwise requires, as used in this annual report on Form 10-K:
| · | “NI Holdings”, “the Company”, “we”, “us”, and “our” refer to NI Holdings, Inc., together with Nodak Insurance Company and its subsidiaries and its affiliate (Battle Creek Mutual Insurance Company) and Direct Auto Insurance Company (acquired August 31, 2018), for periods discussed after completion of the conversion, and for periods discussed prior to completion of the conversion refer to Nodak Mutual Insurance Company and all of its subsidiaries and Battle Creek Mutual Insurance Company; |
| · | “Nodak Mutual Group” refers to Nodak Mutual Group, Inc., which is the majority shareholder of NI Holdings; |
| · | the “conversion” refers to the series of transactions by which Nodak Mutual Insurance Company converted from a mutual insurance company to a stock insurance company, as Nodak Insurance Company, and became a wholly-owned subsidiary of NI Holdings, an intermediate stock holding company formed on the date of conversion; |
| · | “Nodak Stock” refers to Nodak Insurance Company, the successor company to Nodak Mutual Insurance Company after the conversion; |
| · | “Nodak Mutual” refers to Nodak Mutual Insurance Company, the predecessor company to Nodak Insurance Company prior to the conversion; |
| · | “Nodak Insurance” refers to Nodak Stock or Nodak Mutual interchangeably; |
| · | “members” refers to the policyholders of Nodak Insurance, who are the named insureds under insurance policies issued by Nodak Insurance; |
| · | “Battle Creek” refers to Battle Creek Mutual Insurance Company. Battle Creek is not a subsidiary of Nodak Insurance, but all of its insurance policies are reinsured by Nodak Insurance through a 100% quota-share reinsurance agreement and Battle Creek is controlled by Nodak Insurance as a result of an affiliation agreement between Battle Creek and Nodak Insurance. Battle Creek is consolidated with Nodak Insurance for financial reporting purposes; and |
| · | “Direct Auto” refers to Direct Auto Insurance Company. On August 31, 2018, NI Holdings completed the acquisition of 100% (directly or indirectly) of the common stock of Direct Auto from private shareholders. Direct Auto became a consolidated subsidiary of NI Holdings on this date. Direct Auto is a property and casualty insurance company specializing in non-standard automobile insurance in the state of Illinois. |
This document contains forward-looking statements, which can be identified by the use of such words as “estimate”, “project”, “believe”, “could”, “may”, “intend”, “anticipate”, “plan”, “seek”, “expect” and similar expressions. These forward-looking statements include:
| · | statements of goals, intentions and expectations; |
| · | statements regarding prospects and business strategy; and |
| · | estimates of future costs, benefits and results. |
The forward-looking statements are subject to numerous assumptions, risks and uncertainties, including, among other things, the factors discussed under the heading “Risk Factors” that could affect the actual outcome of future events.
All of these factors are difficult to predict and many are beyond our control. These important factors include those discussed under “Risk Factors” and those listed below:
| · | material changes to the federal crop insurance program; |
| · | future economic conditions in the markets in which we compete that are less favorable than expected; |
1
| · | the effect of legislative, judicial, economic, demographic and regulatory events in the jurisdictions where we do business; |
| · | our ability to enter new markets successfully and capitalize on growth opportunities either through acquisitions or the expansion of our producer network; |
| · | our ability to successfully integrate Direct Auto; |
| · | financial market conditions, including, but not limited to, changes in interest rates and the stock markets causing a reduction of investment income or investment gains and a reduction in the value of our investment portfolio; |
| · | heightened competition, including specifically the intensification of price competition, the entry of new competitors and the development of new products by new or existing competitors, resulting in a reduction in the demand for our products; |
| · | changes in general economic conditions, including inflation, unemployment, interest rates and other factors; |
| · | estimates and adequacy of loss reserves and trends in loss and loss adjustment expenses; |
| · | changes in the coverage terms required by state laws with respect to minimum auto liability insurance, including higher minimum limits; |
| · | our inability to obtain regulatory approval of, or to implement, premium rate increases; |
| · | our ability to obtain reinsurance coverage at reasonable prices or on terms that adequately protect us and to collect amounts that we believe we are entitled to under such reinsurance; |
| · | the potential impact on our reported net income that could result from the adoption of future accounting standards issued by the Public Company Accounting Oversight Board, the Financial Accounting Standards Board, or other standard-setting bodies; |
| · | unanticipated changes in industry trends and ratings assigned by nationally recognized rating organizations; |
| · | the potential impact of fraud, operational errors, systems malfunctions, or cybersecurity incidents; |
| · | adverse litigation or arbitration results; and |
| · | adverse changes in applicable laws, regulations or rules governing insurance holding companies and insurance companies, and tax or accounting matters including limitations on premium levels, increases in minimum capital and reserves, and other financial viability requirements, and changes that affect the cost of, or demand for our products. |
Because forward-looking information is subject to various risks and uncertainties, actual results may differ materially from that expressed or implied by the forward-looking information.
2
| Item 1. | Business |
All dollar amounts, except per share amounts, are in thousands.
Overview
NI Holdings is a North Dakota business corporation that is the stock holding company of Nodak Insurance Company and became such in connection with the conversion of Nodak Mutual Insurance Company from a mutual to stock form of organization and the creation of a mutual holding company. The conversion was consummated on March 13, 2017. Immediately following the conversion, all of the outstanding shares of common stock of Nodak Insurance Company were issued to Nodak Mutual Group, which then contributed the shares to NI Holdings in exchange for 55% of the outstanding shares of common stock of NI Holdings. Nodak Insurance Company then became a wholly-owned stock subsidiary of NI Holdings. Prior to completion of the conversion, NI Holdings conducted no business and had no assets or liabilities. As a result of the conversion, NI Holdings became the holding company for Nodak Insurance Company and its existing subsidiaries.
Nodak Insurance was formed in 1946 to offer property and casualty insurance to members of the North Dakota Farm Bureau Federation (“North Dakota Farm Bureau”). Nodak Insurance’s bylaws provide that a person must be a member and remain a member of the North Dakota Farm Bureau in order to become and remain a policyholder of Nodak Insurance. Nodak Insurance’s bylaws also require that four members of the Board of Directors of Nodak Insurance must be members of the North Dakota Farm Bureau. Similarly, one-third of the members of the Board of Directors of Nodak Mutual Group must be persons designated by the North Dakota Farm Bureau.
The North Dakota Farm Bureau has granted Nodak Insurance a nonexclusive, nontransferable license to use the name “Farm Bureau” and the “FB” logo and associated trademarks to market Nodak Insurance products, including insurance products. Nodak Insurance has held this license since the insurance company’s inception in 1946, and the current version of the license agreement has been in place since 2002. The current license agreement between the North Dakota Farm Bureau and Nodak Insurance renewed on October 1, 2018, with an expiration date of September 30, 2019. The agreement has historically been renewed annually by a vote of the Nodak Insurance Board of Directors. Under the current license agreement, Nodak Insurance is required to pay to the North Dakota Farm Bureau an annual royalty payment equal to 1.3% of Nodak Insurance’s written premiums (excluding multi-peril crop insurance premiums), subject to a minimum annual payment of $900 and a maximum annual payment of $1,341. The maximum royalty payment is adjusted annually based upon the June index month for the Consumer Price Index.
Nodak Insurance’s subsidiaries include American West Insurance Company (“American West”) and Primero Insurance Company (“Primero”). Battle Creek Mutual Insurance Company is an affiliate of Nodak Insurance. Nodak Insurance and Battle Creek have been assigned “A” ratings by A.M. Best Company, Inc. (“A.M. Best”), which is the third highest out of 15 possible ratings. American West is rated A-. Primero and Direct Auto are unrated.
On August 31, 2018, NI Holdings completed the acquisition of 100% of the common stock of Direct Auto Insurance Company (“Direct Auto”) from private shareholders and Direct Auto became a consolidated subsidiary of the Company. The results of Direct Auto are included as part of the Company’s non-standard auto business segment following the closing date.
The consolidated financial statements of NI Holdings presented herein include the financial position and results of operations of NI Holdings, Direct Auto (after the acquisition date of August 31, 2018), and Nodak Insurance, including Nodak Insurance’s subsidiaries American West and Primero, and its affiliate Battle Creek. Each of the five insurance companies is subject to examination and comprehensive regulation by the insurance department of its state of domicile.
3
A chart of the corporate structure and a more complete description of each of the NI Holdings subsidiaries is included below.
| NI HOLDINGS, INC. ORGANIZATIONAL CHART |
||||||||||||
| Nodak Mutual Group, Inc. | ||||||||||||
| ≥ 55% | ||||||||||||
| ownership | ||||||||||||
| NI Holdings, Inc. | ||||||||||||
| 100% | 100% | |||||||||||
| ownership | ownership | |||||||||||
| Nodak Insurance Company | Direct Auto Insurance Company | |||||||||||
| 100% | 100% | 100% | ||||||||||
| ownership | ownership | Affiliation | ownership | |||||||||
| Nodak Agency, Inc. | American West Insurance Company | Battle Creek Mutual Insurance Company | Tri-State, Ltd | |||||||||
| 100% | ||||||||||||
| ownership | ||||||||||||
| Primero Insurance Company | ||||||||||||
The following tables provide selected amounts from the Company’s consolidated statements of operations and balance sheets. Additional information is presented throughout this annual report.
| Year Ended December 31, | ||||||||||||
| 2018 | 2017 | 2016 | ||||||||||
| Direct premiums written | $ | 225,223 | $ | 195,238 | $ | 180,870 | ||||||
| Net premiums earned | 195,720 | 179,464 | 152,756 | |||||||||
| Net income after non-controlling interest | 31,081 | 15,991 | 4,551 | |||||||||
| December 31, | ||||||||||||
| 2018 | 2017 | 2016 | ||||||||||
| Total assets | $ | 458,492 | $ | 376,988 | $ | 278,703 | ||||||
| Equity | 275,753 | 255,573 | 153,418 | |||||||||
The executive offices of NI Holdings and Nodak Insurance are located at 1101 1st Avenue North, Fargo, North Dakota 58102, and the main office phone number is 701-298-4200. NI Holdings’ website address is www.niholdingsinc.com. Information contained on such website is not incorporated by reference into this Annual Report on Form 10-K, and such information should not be considered to be part of this Annual Report on Form 10-K.
Nodak Insurance Company (“Nodak Insurance”)
Nodak Insurance writes multi-peril crop, crop hail, private passenger automobile, farmowners, homeowners, and commercial property and liability policies in North Dakota. Only members of the North Dakota Farm Bureau can purchase insurance coverage from Nodak Insurance. As of December 31, 2018, Nodak Insurance distributed its insurance products through 74 exclusive agents appointed by Nodak Insurance.
4
American West Insurance Company (“American West”)
American West is licensed to write insurance in eight states in the Midwest and Western regions of the United States, but currently issues policies in South Dakota, Minnesota, and North Dakota. American West currently issues multi-peril crop, crop hail, farmowners, private passenger auto, and homeowners insurance primarily in South Dakota. American West distributes its products through independent agents located in approximately 120 offices.
Battle Creek Mutual Insurance Company (“Battle Creek”)
Battle Creek issues private passenger automobile, homeowners, and farmowners policies in Nebraska. Battle Creek distributes its policies through independent agents located in approximately 270 offices. Battle Creek became affiliated with Nodak Insurance in 2011, and Nodak Insurance provides underwriting, claims management, policy administration, and other administrative services to Battle Creek. Under a 100% quota-share reinsurance agreement, Battle Creek cedes 100% of its net premiums to Nodak Insurance and Nodak Insurance fully reinsures all of Battle Creek’s risk under its insurance policies. In connection with entering into the affiliation agreement, Nodak Insurance purchased a $3.0 million surplus note issued by Battle Creek. The surplus note bears interest at an annual rate of 1.0% and matures on December 30, 2040. Battle Creek must obtain the prior approval of the Nebraska Director of Insurance before making any payment of interest or principal on the surplus note.
Pursuant to the affiliation agreement, so long as the surplus note remains outstanding or the 100% quota-share reinsurance is in effect, Nodak Insurance is entitled to appoint two-thirds of the Board of Directors of Battle Creek. The affiliation agreement can be terminated by mutual written agreement of Battle Creek and Nodak Insurance or by either party if there is a material breach of the agreement by the other party and such breach is not cured within 15 days after written notice of such breach is given by the terminating party to the other party. If Battle Creek terminated the quota-share reinsurance agreement, it would not have sufficient capital to continue to operate.
Primero Insurance Company (“Primero”)
Primero writes non-standard automobile insurance in Nevada, Arizona, North Dakota, and South Dakota. Primero was acquired by Nodak Insurance in 2014. Primero distributes its policies through independent agents located in approximately 335 offices in those four states.
Direct Auto Insurance Company (“Direct Auto”)
Direct Auto writes non-standard automobile insurance in Illinois. Direct Auto was acquired by NI Holdings on August 31, 2018. Direct Auto distributes its policies through independent agents located in approximately 200 offices, concentrated primarily in the Chicago area.
5
Market Overview
We market our property and casualty products in the upper Midwest states of North Dakota, South Dakota, Nebraska, and Minnesota. We also offer non-standard auto insurance in the states of Nevada, Arizona, North Dakota, South Dakota, and Illinois. The following chart depicts our direct premiums written during the last two years and our relative market share within each of our states during the year ended December 31, 2017.
| Year Ended December 31, 2018 | Year Ended December 31, 2017 | |||||||||||||||
| Direct Premiums Written | Direct Premiums Written | Market Size | Rank in State | |||||||||||||
| North Dakota | $ | 143,761 | $ | 138,950 | $ | 2,521,000 | 4 | th | ||||||||
| Nebraska | 37,819 | 33,358 | 4,842,000 | 33 | rd | |||||||||||
| Illinois (1) | 14,072 | — | 24,907,000 | 80 | th | |||||||||||
| South Dakota | 12,980 | 8,227 | 2,421,000 | 46 | th | |||||||||||
| Minnesota | 5,137 | 5,945 | 11,586,000 | 106 | th | |||||||||||
| Nevada | 9,105 | 6,390 | 5,145,000 | 82 | nd | |||||||||||
| Arizona | 2,349 | 2,368 | 10,961,000 | 159 | th | |||||||||||
| Total direct premiums written | $ | 225,223 | $ | 195,238 | ||||||||||||
| (1) Direct Auto’s full year 2017 direct written premiums were $36,227 for purposes of determining its market share in the state of Illinois. | ||||||||||||||||
Organic Growth Strategy
We believe we have many opportunities to increase business in our primary markets organically. Strategies we employ to grow organically include:
| · | continued emphasis on our relationship with the North Dakota Farm Bureau, a key advocacy group for agricultural and rural interests which enjoys a high and favorable profile throughout the state; |
| · | using the cost advantage created by our low expense ratio compared to peers (28.0% expense ratio in 2018 compared to an average expense ratio of our peers of 36.6% in 2017) to selectively expand market share in our primary markets; |
| · | expansion and enhancement of agency relationships in Nebraska and South Dakota, including the use of technology such as mobile apps, online quoting, and policy issuance initiatives to make it easy for independent agents and insureds to do business with us; |
| · | selective expansion of Primero in its core markets of Nevada and Arizona as well as expansion of the non-standard auto product in our core upper Midwest market area; |
| · | strategic growth in Direct Auto non-standard auto business; |
| · | excellent claims service for all insureds; and |
| · | selective expansion of our insurance products in states where we currently operate and those states where we hold insurance licenses. |
External Growth Strategy
We acquired Direct Auto in 2018 and integration of this business into our operations is in progress. We successfully acquired Primero in 2014 and acquired control of Battle Creek in 2011. American West was acquired in 2001. With the additional capital we raised through our initial public offering, we desire to make additional selective acquisitions that complement our strategy. Areas of current interest include acquisition of a commercial writer and geographic expansion of existing product lines. The acquisition of a commercial writer would help us to better balance our book of business among personal lines insurance, multi-peril
6
crop insurance, and commercial lines insurance in which we currently write only a limited amount of business. Selective geographic expansion would help to diversify our weather-related risks and assist us in maintaining competitive expense levels.
The completion of our initial public offering supplied the additional capital needed to support substantial increases in premium volume, which we expect to result from the implementation of both our organic and external growth strategies.
Products and Services
Private Passenger Auto
Nodak Insurance, Battle Creek, and American West each write private passenger auto insurance to provide protection against liability for bodily injury and property damage arising from automobile accidents and protection against loss from damage to automobiles owned by the insured. Private passenger auto accounted for $67,038 (29.8%) of direct premiums written by the Company on a consolidated basis during 2018.
Non-standard Auto
Primero and Direct Auto write non-standard auto insurance with a focus on minimum-limit auto liability coverage. Direct premiums written on non-standard auto insurance during 2018 were $27,423 (12.2%) of direct premiums written by the Company on a consolidated basis during 2018.
Home and Farm
Nodak Insurance, Battle Creek, and American West each write homeowners and farmowners policies to provide coverage for damage to buildings, equipment, and contents for a variety of perils, including fire, lightning, wind, hail, and theft. These policies also cover liability arising from injury to other persons or their property while on the insured’s premises. Home and farm accounted for $74,547 (33.1%) of direct premiums written by the Company on a consolidated basis during 2018.
Crop
Crop hail and multi-peril crop insurance policies are also offered by Nodak Insurance, American West, and Battle Creek. Multi-peril crop insurance is a federal program that protects against crop yield losses from all types of natural causes including drought, excessive moisture, freeze, and disease. Crop hail insurance is a private insurance product designed to provide protection against losses to farmer’s crops due primarily to hail damage. Collectively, crop insurance accounted for $47,504 (21.1%) of direct premiums written by the Company on a consolidated basis during 2018.
All Other
In addition to the products described above, Nodak Insurance and American West write commercial multi-peril policies and excess liability coverages. Collectively, these other coverages accounted for $8,711 (3.8%) of the direct premiums written by the Company on a consolidated basis during 2018. This segment also includes an assumed reinsurance block of business, with $4,135 of assumed premiums written on a consolidated basis during 2018.
Crop Insurance
Crop insurance is purchased by agricultural producers, including farmers, ranchers, and others to protect themselves against either the loss of their crops (yield) due to natural disasters, such as hail, drought, and floods, or the loss of revenue due to declines in the prices of agricultural products. The two general categories of crop insurance are generally referred to as “crop-yield insurance” and “crop-revenue insurance”. Crop-yield insurance protects against a reduction in the yield per acre from the historical average yield in a specified area, such as a county or National Oceanic and Atmospheric Administration weather grid, while crop-revenue insurance provides protection against declines in the price of the particular crop. Most of the multi-peril crop insurance policies written today combine both yield and revenue protection, with the revenue component providing the policyholder with the option to calculate price-based losses on the higher of the prevailing price when the crop is planted or the price at harvest.
Beginning in 1980, the U.S. Congress expanded the federal crop insurance program to cover more crops and regions of the country. More importantly, Congress permitted private sector insurers to market and administer federal insurance policies in exchange for an opportunity to earn a profit while bearing a portion of the insurance risk. Congress also authorized a premium subsidy for the farmers and ranchers. As a result, there was a rapid increase in the acres insured from approximately 26 million acres in 1980 to 100 million acres in 1990. The Federal Crop Insurance Reform Act of 1994 made participation in the crop insurance
7
program mandatory for farmers to be eligible to participate in other government support programs and provided a minimum level of free catastrophic risk coverage for insured and noninsured crops.
In 2018, the federal crop insurance program covered approximately 23.6 million acres in North Dakota, 18.3 million acres in South Dakota, 17.6 million acres in Minnesota, and 335.4 million acres nationwide. In 2018, Nodak Insurance multi-peril crop insurance policies covered approximately 1.8 million acres in North Dakota. During the same period, American West crop insurance policies covered approximately 13,000 acres in South Dakota and approximately 139,000 acres in Minnesota. Nodak Insurance, through its Battle Creek affiliate, writes a very small amount of multi-peril crop insurance in Nebraska.
American Farm Bureau Insurance Services (“AFBIS”) underwrites all of the multi-peril crop and crop hail insurance policies written by Nodak Insurance, American West, and Battle Creek, as well as several other state Farm Bureau-affiliated insurers. AFBIS also processes and administers all claims made by policyholders under such policies. We reimburse AFBIS for its actual loss adjustment expense with respect to the policies issued by us and pay AFBIS a percentage of the premiums we received with respect to such policies. Nodak Insurance is a shareholder of AFBIS, as is each of the other insurers for whom AFBIS provides such services. AFBIS targets a three percent return on capital and pays all remaining profits to Nodak Insurance and the other shareholders of AFBIS. Nodak Insurance did not receive any material distributions from AFBIS during the years ended December 31, 2016 through 2018.
Segment Financial Information
See Note 21 to the Consolidated Financial Statements for the Company’s segment disclosures.
Marketing and Distribution
Our marketing philosophy is to sell profitable business in our core states, using a focused, cost-effective distribution system. Nodak Insurance distributes its insurance products through exclusive agents in North Dakota, while American West, Battle Creek, Primero, and Direct Auto rely on independent producers. We view these independent producers as important partners because they are in a position to recommend either our insurance products or those of a competitor to their customers. We consider our relationships with these producers to be good.
We review our producers with respect to both premium volume and profitability. Our exclusive agents in Nodak Insurance are hired and trained by our sales staff in North Dakota, while the independent producers in our other companies are appointed by the underwriting or marketing staff for each respective company. We hold regular training sessions when we introduce new products or product changes, or we identify specific topics that may help our producers more effectively market our products.
For the year ended December 31, 2018, no individual producer was responsible for more than 5% of the Company’s direct premiums written by our insurance companies. Direct Auto had six agencies generate more than 5% of their 2018 annual production.
Producers are compensated through a fixed base commission structure. Agents receive commission as a percentage of premiums (generally 5% to 40%, with a wide variation by product) as their primary compensation from us. The Risk Management Agency of the United States Department of Agriculture (“RMA”) establishes the maximum commission that can be paid to producers with respect to crop insurance policies. Battle Creek and American West pay profit sharing commissions to their agencies based on various annual agency premium thresholds and the difference between the agency’s loss ratio and the loss ratio goal established by the insurance company. The commission is paid with respect to all property and casualty (non-crop) business earned within the calendar year. Nodak Insurance pays a profit sharing commission to its agents only with respect to farmowners business originated by such agents.
Our marketing efforts are further supported by our claims philosophy, which is designed to provide prompt and efficient service and claims processing, resulting in a positive experience for producers and policyholders. We believe that these positive experiences result in higher policyholder retention and new business opportunities when communicated by producers and policyholders to potential customers. While we rely on our independent agents for distribution and customer support, underwriting and claim handling responsibilities are retained by us. Many of our agents have had direct relationships with us for a number of years.
Underwriting, Risk Assessment and Pricing
Our underwriting philosophy is aimed at consistently generating profits through sound risk selection and pricing discipline. Through our management and underwriting staff, we regularly establish rates and rating classifications for our insureds based on loss
8
and loss adjustment expense (“LAE”) experience we have developed over the years. We have various rating classifications based on location, type of business, and other risk factors.
The nature of our business requires that we remain sensitive to the marketplace and the pricing strategies of our competitors. Using the market information as our background, we normally set our prices based on our estimated future costs. From time to time, we may reduce our discounts or apply a premium surcharge to achieve an appropriate return. Pricing flexibility allows us to provide a fair rate commensurate with the assumed risk. If our pricing strategy cannot yield sufficient premium to cover our costs on a particular type of risk, we may determine not to underwrite that risk. It is our philosophy not to sacrifice profitability for premium growth.
Our competitive strategy in underwriting is to provide very high quality service to our producers and insureds by responding quickly and effectively to information requests and policy submissions. We maintain information on all aspects of our business, which is regularly reviewed to determine both agency and policyholder profitability. Specific information regarding individual insureds is monitored to assist us in making decisions about policy renewals or modifications.
Our underwriting staff includes 22 employees with over 360 combined years of experience in property and casualty underwriting. They are located primarily at our home office in Fargo, North Dakota, as well as our office in Battle Creek, Nebraska, and underwrite coverage issued by Nodak Insurance, American West and Battle Creek. Primero employs an additional 3 underwriters and Direct Auto employs 4 underwriters in connection with their non-standard auto insurance business. All of our crop insurance is underwritten by AFBIS, as described in an earlier section.
We strive to be disciplined in our pricing by pursuing rate increases to maintain or improve our underwriting profitability while still being able to attract and retain customers. We utilize pricing reviews that we believe will help us price risks more accurately, improve account retention, and support the production of profitable new business. Our pricing reviews involve evaluating our claims experience and loss trends on a periodic basis to identify changes in the frequency and severity of our claims. We then consider whether our premium rates are adequate relative to the level of underwriting risk as well as the sufficiency of our underwriting guidelines.
Claims and Litigation Management
Our claims management philosophy involves:
| · | aggressive closure of claims through prompt and thorough investigation of the facts related to the claim; |
| · | equitable settlement of meritorious claims; and |
| · | vigorous defense of unfounded claims as to coverage, liability, or the amount claimed. |
Our claims team supports our underwriting strategy by working to provide a timely, good faith claims handling response to our policyholders. Claims excellence is achieved by timely investigation and handling of claims, settlement of meritorious claims for equitable amounts, maintenance of adequate case reserves, and control of claims loss adjustment expenses.
Claims on insurance policies are received directly from the insured or through our producers. Our claims department supports our producer relationship strategy by working to provide a consistently responsive level of claim service to our policyholders.
Our claims staff is comprised of 45 employees with over 760 years of combined experience in processing property and casualty insurance claims. They are located primarily at our home office in Fargo, North Dakota, but also throughout our coverage areas of North Dakota, South Dakota, and Nebraska. Primero also employs 12 claims personnel and Direct Auto employs 29 claims personnel in connection with the non-standard auto insurance business. All claims made under our multi-peril crop and crop hail insurance policies are processed and administered by AFBIS.
Technology
Our insurance operations rely on software to provide the information management systems platform that runs our policy underwriting, policy issuance, claims processing, and accounting functions. These systems permit us to integrate the accounting and reporting functions of all of our insurance operations. We utilize offsite servers for our information systems with daily backup of data. We have adopted a disaster recovery plan, and other risk mitigation practices, tailored to meet our needs and geographic location. We seek to invest continuously in new technology to maximize our business opportunities while protecting our interests and those of our clients.
9
Enterprise Risk Management
Our Company is subject to significant risks, in addition to the normal risks of a property and casualty insurance company. These risks are discussed in more detail in the “Item 1A. Risk Factors” section of this Report.
We consider an enterprise-wide risk management program to be an integral part of managing our business and a key element in our approach to corporate governance. Our Enterprise Risk Management Committee (the “ERMC”) is responsible for the alignment of operational risk management strategies as the coordination point for enterprise-level direction setting with regard to risk management issues. The ERMC regularly monitors risk reports and metrics regarding a variety of continuing and emerging risks that may adversely affect the Company, its policyholders, or other stakeholders. The Audit Committee of the Board of Directors oversees risk management and regularly receives reports from the ERMC.
Cybersecurity risk is an important and evolving focus for the Company. The increased sophistication and activities of unauthorized parties attempting to access our systems is an ever-present risk. Cybersecurity risks may also arise from human error, fraud, or malice on the part of employees or third parties who have authorized access to the Company’s systems or information.
Our cybersecurity strategy employs a variety of tactics to monitor and assess threat levels, remediate our exposures, and enhance our systems and applications security. The Company collaborates with a third party cybersecurity advisor to provide periodic assessments and recommendations. The Company also requires monthly online security training to be completed by employees.
Reinsurance
Reinsurance Ceded
We reinsure a portion of our exposure and pay to the reinsurers a portion of the premiums received on all policies reinsured. Insurance policies written by us are reinsured with other insurance companies principally to:
| · | reduce our net liability exposure on individual risks; |
| · | stabilize our underwriting results; and |
| · | increase our underwriting capacity. |
Reinsurance does not legally discharge us, as the insurance company issuing the policy, from primary liability for the full amount due under the reinsured policies, even though the assuming reinsurer is obligated to reimburse the company issuing the policy to the extent of the coverage ceded.
A primary factor in the selection of reinsurers from whom we purchase reinsurance is their financial strength. Our reinsurance arrangements are generally renegotiated annually or bi-annually. For the year ended December 31, 2018, NI Holdings ceded to reinsurers $30,394 of written premiums, compared to $16,665 of written premiums for the year ended December 31, 2017 and $30,748 of written premiums for the year ended December 31, 2016. The higher levels of premiums ceded in 2018 and 2016 were primarily due to additional sharing of multi-peril crop insurance premiums with the federal government as a result of the excellent loss experience in those years.
The chart below illustrates the reinsurance coverage under our excess of loss treaty for individual casualty risks during the years 2016 through 2018:
| Losses Incurred | Retained by Nodak Insurance | Ceded Under Reinsurance Treaty | ||||||
| Up to $600 | 100.0% | 0.0% | ||||||
| $11,400 in excess of $600 | 0.0% | 100.0% | ||||||
The chart below illustrates the reinsurance coverage under our excess of loss treaty for individual property risks during the years 2016 through 2018:
| Losses Incurred | Retained by Nodak Insurance | Ceded Under Reinsurance Treaty | ||||||
| Up to $500 | 100.0% | 0.0% | ||||||
| $19,500 in excess of $500 | 0.0% | 100.0% | ||||||
10
As a group, during the years ended December 31, 2018 and 2017, Nodak Insurance, American West, and Battle Creek retained $10,000 of weather-related losses from catastrophic events and had reinsurance under various reinsurance agreements up to $74,600 in excess of the $10,000 retained risk. For 2019, the catastrophe retention amount remains at $10,000 while the catastrophic reinsurance increased to $78,600. Prior to January 1, 2017, the group collectively retained the first $5,000 of weather related losses.
The insolvency or inability of any reinsurer to meet its obligations to us could have a material adverse effect on our results of operations or financial condition. NI Holdings’ reinsurance providers, the majority of whom are longstanding partners that understand our business, are all carefully selected with the help of our reinsurance brokers. We monitor the solvency of reinsurers through regular review of their financial statements and their A.M. Best ratings. All of our current reinsurance partners have at least an “A-” financial strength rating from A.M. Best. We dropped one reinsurance partner, Maiden Reinsurance North America, from our program during 2018, due to a ratings decrease by A.M. Best to “B++”. According to A.M. Best, companies with a financial strength rating of “A-” or better “have an excellent ability to meet their ongoing obligations to policyholders.” We have experienced no significant difficulties collecting amounts due from reinsurers.
Reinsurance for multi-peril crop insurance is provided by the Federal Crop Insurance Corporation (“FCIC”). Insurers can assign each policy issued to either its “assigned risk” or “commercial” fund. The FCIC retains an increasing percentage of underwriting losses at successively higher loss ratios while ceding an increasing percentage of the premium at lower loss ratios. The commercial fund permits insurers to retain more of the underwriting gains and losses, while the assigned risk fund cedes up to 80% of the risk to the FCIC. The exact treatment of the commercial fund varies by state groups. In Group 1, which includes Illinois, Indiana, Iowa, Minnesota and Nebraska, the FCIC retains a larger share of the underwriting gains and a smaller portion of the underwriting losses when compared to all other states. Aggregate stop loss reinsurance is purchased for crop hail and multi-peril insurance. During 2018, we purchased fifty percentage points of coverage above a 100% direct loss ratio for crop hail and we purchased forty-five percentage points of coverage for multi-peril crop above a 105% loss ratio after the FCIC reinsurance protection. This represents the worst loss exposure given the FCIC formula, thereby capping the multi-peril crop loss ratio at 105%.
The following table sets forth the largest amounts of loss and LAE recoverable by the Company from reinsurers as of December 31, 2018 and the current A.M. Best rating of each as of February 12, 2019.
| Reinsurance Company | Loss & LAE Recoverable On Unpaid Claims | Percentage of Total Recoverable | A.M. Best Rating | |||||||
| American Agricultural Insurance Company | $ | 108 | 4.8% | A | ||||||
| Aspen Insurance UK Limited | 208 | 9.3% | A | |||||||
| Employers Mutual Casualty Company | 66 | 3.0% | A | |||||||
| Everest Reinsurance Company | 172 | 7.7% | A+ | |||||||
| Federal Crop Insurance Corporation | 384 | 17.2% | NR | |||||||
| General Reinsurance Company | 198 | 8.9% | A++ | |||||||
| Hannover Rueck SE | 347 | 15.6% | A+ | |||||||
| Maiden Reinsurance North America | 315 | 14.1% | B++ | |||||||
| Munich Reinsurance of America | 1 | 0.0% | A+ | |||||||
| Partner Reinsurance Company Ltd | 261 | 11.7% | A | |||||||
| QBE Reinsurance Corporation | 84 | 3.8% | A | |||||||
| Scor Reinsurance Company | 87 | 3.9% | A+ | |||||||
| Toa Reinsurance Company of America | 1 | 0.0% | A | |||||||
| Total reinsurance recoverables | $ | 2,232 | 100.0% | |||||||
Reinsurance Assumed
Nodak Insurance assumes 100% of the risk under policies written by Battle Creek. In addition, Nodak Insurance is required by statute to participate in certain residual market pools. This participation requires Nodak Insurance to assume business for property exposures that are not insured in the voluntary marketplace. Nodak Insurance participates in these residual markets pro rata on a market share basis.
Additionally, through American Agriculture Insurance Company (affiliated with the American Farm Bureau Federation), Nodak Insurance participates in both domestic and international property insurance pools. Annually, Nodak Insurance reviews the available pools and selects the pools in which it will participate. No multi-peril crop or crop hail insurance policies are included in such pools. Participation in such pools provides Nodak Insurance with the opportunity to diversify its risk while increasing its annual net premiums earned. In 2018, 2017 and 2016, Nodak Insurance assumed $3,945, $3,959, and $3,634, respectively, of written premiums from such pools.
11
Beginning on January 1, 2016, Nodak Insurance assumed 100% of the crop hail premiums and losses from American West and Rural Mutual Insurance Company (a company affiliated with the Wisconsin Farm Bureau Federation). The business was then pooled annually with Nodak Insurance’s crop hail business and proportionately retroceded back to each participant. This crop hail pool allows Nodak Insurance and American West to diversify their crop insurance risk across an additional geographic region.
Unpaid Loss and Loss Adjustment Expense
NI Holdings is required by applicable insurance laws and regulations to maintain reserves for unpaid losses and LAE. Our liability for unpaid losses and LAE consists of (1) case reserves, which are reserves for claims that have been reported to us, and (2) reserves for claims that have been incurred but not yet been reported and for the future development of case reserves (“IBNR”). The laws and regulations require that provision be made for the ultimate cost of those claims without regard to how long it takes to settle them or the time value of money. The determination of reserves involves actuarial and statistical projections of what we expect to be the cost of the ultimate settlement and administration of such claims. The liability for unpaid losses and LAE is set based on facts and circumstances then known, estimates of future trends in claims severity, and other variable factors such as inflation and changing judicial theories of liability.
Estimating the ultimate liability for unpaid losses and LAE is an inherently uncertain process. Therefore, the liability for unpaid losses and LAE does not represent an exact calculation of that liability. Our reserving policy recognizes this uncertainty by maintaining reserves at a level providing for the possibility of adverse development relative to the estimation process.
When a claim is reported to us, our claims personnel establish a case reserve for the estimated amount of the ultimate payment to the extent it can be determined or estimated. This estimate reflects an informed judgment based upon general insurance reserving practices and on the experience and knowledge of our claims staff. In estimating the appropriate reserve, our claims staff considers the nature and value of the specific claim, the severity of injury or damage, and the policy provisions relating to the type of loss, to the extent determinable at the time. Case reserves are adjusted by our claims staff as more information becomes available. It is our policy to settle each claim as expeditiously as possible.
We maintain IBNR reserves to provide for already incurred claims that have not yet been reported and development on reported claims. The IBNR reserve is determined by estimating our ultimate net liability for both reported and IBNR claims, and then subtracting the case reserves and paid losses and LAE for reported claims.
Each quarter, NI Holdings computes its estimated ultimate liability using its methodologies and procedures. However, because the establishment of loss reserves is an inherently uncertain process, we cannot assure you that ultimate losses will not exceed the established loss reserves. Adjustments in aggregate reserves, if any, are reflected in the operating results of the period during which such adjustments are made.
12
The following table provides a reconciliation of beginning and ending unpaid losses and LAE reserve balances of NI Holdings for the years ended December 31, 2018, 2017 and 2016.
| Year Ended December 31, | ||||||||||||
| 2018 | 2017 | 2016 | ||||||||||
| Balance at beginning of year: | ||||||||||||
| Liability for unpaid losses and loss adjustment expenses | $ | 45,890 | $ | 59,632 | $ | 45,342 | ||||||
| Reinsurance recoverables on losses | 4,128 | 7,192 | 5,109 | |||||||||
| Net balance at beginning of year | 41,762 | 52,440 | 40,233 | |||||||||
| Acquired unpaid losses and loss adjustment expenses related to: | ||||||||||||
| Current year | 17,795 | — | — | |||||||||
| Prior years | 23,172 | — | — | |||||||||
| Total acquired | 40,967 | — | — | |||||||||
| Incurred related to: | ||||||||||||
| Current year | 119,677 | 132,812 | 123,264 | |||||||||
| Prior years | (589 | ) | (10,101 | ) | (4,756 | ) | ||||||
| Total incurred | 119,088 | 122,711 | 118,508 | |||||||||
| Paid related to: | ||||||||||||
| Current year | 92,175 | 104,769 | 90,772 | |||||||||
| Prior years | 24,753 | 28,620 | 15,529 | |||||||||
| Total paid | 116,928 | 133,389 | 106,301 | |||||||||
| Balance at end of year: | ||||||||||||
| Liability for unpaid losses and loss adjustment expenses | 87,121 | 45,890 | 59,632 | |||||||||
| Reinsurance recoverables on losses | 2,232 | 4,128 | 7,192 | |||||||||
| Net balance at end of year | $ | 84,889 | $ | 41,762 | $ | 52,440 | ||||||
The estimation process for determining the liability for unpaid losses and LAE inherently results in adjustments each year for claims incurred (but not paid) in preceding years. Negative amounts reported for claims incurred related to prior years are a result of claims being settled for amounts less than originally estimated (favorable development). Positive amounts reported for claims incurred related to prior years are a result of claims being settled for amounts greater than originally estimated (unfavorable or adverse development).
13
The following table shows the development of NI Holding’s liability for unpaid loss and LAE from 2008 through 2018. The top line of the table shows the liabilities at the balance sheet date, including losses incurred but not yet reported. The upper portion of the table shows the cumulative amounts subsequently paid as of successive years with respect to the liability. The lower portion of the table shows the re-estimated amount of the previously recorded liability based on experience as of the end of each succeeding year. The estimates fluctuate as more information becomes known about the frequency and severity of claims for individual years. The redundancy (deficiency) exists when the re-estimated liability for each reporting period is less (greater) than the prior liability estimate. The “cumulative redundancy (deficiency)” depicted in the table, for any particular calendar year, represents the aggregate change in the initial estimates over all subsequent calendar years.
Gross deficiencies and redundancies may be significantly more or less than net deficiencies and redundancies due to the nature and extent of applicable reinsurance.
| As of December 31, 2018 | ||||||||||||||||||||||||||||||||||||||||||||
| 2008 | 2009 | 2010 | 2011 | 2012 | 2013 | 2014 | 2015 | 2016 | 2017 | 2018 | ||||||||||||||||||||||||||||||||||
| Liability for unpaid loss and LAE, net of reinsurance recoverables | $ | 29,698 | $ | 30,908 | $ | 28,266 | $ | 23,302 | $ | 25,466 | $ | 42,058 | $ | 44,842 | $ | 40,233 | $ | 52,440 | $ | 41,762 | $ | 84,889 | ||||||||||||||||||||||
| Cumulative amount of liability paid through | ||||||||||||||||||||||||||||||||||||||||||||
| One year later | 13,550 | 12,247 | 11,691 | 11,911 | 5,056 | 16,249 | 18,166 | 14,932 | 28,426 | 22,725 | — | |||||||||||||||||||||||||||||||||
| Two years later | 17,278 | 16,323 | 12,362 | 9,053 | 8,654 | 20,899 | 20,802 | 20,612 | 33,315 | — | — | |||||||||||||||||||||||||||||||||
| Three years later | 17,489 | 16,408 | 15,104 | 11,245 | 11,636 | 21,224 | 23,511 | 23,204 | — | — | — | |||||||||||||||||||||||||||||||||
| Four years later | 17,619 | 17,552 | 15,536 | 13,195 | 11,631 | 22,993 | 25,192 | — | — | — | — | |||||||||||||||||||||||||||||||||
| Five years later | 17,774 | 17,838 | 16,662 | 13,092 | 12,295 | 23,567 | — | — | — | — | — | |||||||||||||||||||||||||||||||||
| Six years later | 17,955 | 18,682 | 16,627 | 13,311 | 12,668 | — | — | — | — | — | — | |||||||||||||||||||||||||||||||||
| Seven years later | 18,617 | 18,405 | 16,629 | 13,451 | — | — | — | — | — | — | — | |||||||||||||||||||||||||||||||||
| Eight years later | 18,139 | 18,324 | 16,726 | — | — | — | — | — | — | — | — | |||||||||||||||||||||||||||||||||
| Nine years later | 18,013 | 18,405 | — | — | — | — | — | — | — | — | — | |||||||||||||||||||||||||||||||||
| Ten years later | 17,968 | — | — | — | — | — | — | — | — | — | — | |||||||||||||||||||||||||||||||||
| Liability estimated after | ||||||||||||||||||||||||||||||||||||||||||||
| One year later | 22,989 | 26,363 | 24,049 | 18,691 | 22,337 | 34,074 | 35,926 | 34,880 | 42,145 | 41,686 | — | |||||||||||||||||||||||||||||||||
| Two years later | 23,100 | 23,492 | 19,815 | 20,144 | 18,788 | 30,380 | 33,058 | 28,431 | 42,813 | — | — | |||||||||||||||||||||||||||||||||
| Three years later | 21,931 | 20,763 | 20,518 | 17,678 | 16,620 | 28,871 | 28,526 | 29,243 | — | — | — | |||||||||||||||||||||||||||||||||
| Four years later | 20,082 | 21,516 | 19,356 | 16,294 | 15,459 | 25,852 | 28,933 | — | — | — | — | |||||||||||||||||||||||||||||||||
| Five years later | 20,031 | 20,724 | 18,403 | 15,184 | 13,864 | 26,120 | — | — | — | — | — | |||||||||||||||||||||||||||||||||
| Six years later | 19,531 | 19,836 | 17,841 | 14,443 | 14,014 | — | — | — | — | — | — | |||||||||||||||||||||||||||||||||
| Seven years later | 19,251 | 19,306 | 17,429 | 14,279 | — | — | — | — | — | — | — | |||||||||||||||||||||||||||||||||
| Eight years later | 18,696 | 19,011 | 17,274 | — | — | — | — | — | — | — | — | |||||||||||||||||||||||||||||||||
| Nine years later | 18,485 | 18,892 | — | — | — | — | — | — | — | — | — | |||||||||||||||||||||||||||||||||
| Ten years later | 18,396 | — | — | — | — | — | — | — | — | — | — | |||||||||||||||||||||||||||||||||
| Cumulative total redundancy (deficiency) | ||||||||||||||||||||||||||||||||||||||||||||
| Gross liability – end of year | 53,770 | 51,413 | 39,332 | 38,852 | 38,007 | 46,900 | 50,518 | 45,342 | 59,632 | 45,890 | 87,121 | |||||||||||||||||||||||||||||||||
| Reinsurance recoverable | 24,072 | 20,505 | 11,066 | 15,550 | 12,541 | 4,842 | 5,676 | 5,109 | 7,192 | 4,128 | 2,232 | |||||||||||||||||||||||||||||||||
| Net liability – end of year | 29,698 | 30,908 | 28,266 | 23,302 | 25,466 | 42,058 | 44,842 | 40,233 | 52,440 | 41,762 | 84,889 | |||||||||||||||||||||||||||||||||
| Gross re-estimated liability – latest | 34,500 | 31,362 | 26,293 | 29,266 | 23,793 | 29,602 | 34,031 | 33,417 | 51,288 | 45,732 | — | |||||||||||||||||||||||||||||||||
| Re-estimated reinsurance recoverables – latest | 16,114 | 12,470 | 9,019 | 14,987 | 9,779 | 3,482 | 5,098 | 4,174 | 8,475 | 4,046 | — | |||||||||||||||||||||||||||||||||
| Net re-estimated liability - latest | 18,386 | 18,892 | 17,274 | 14,279 | 14,014 | 26,120 | 28,933 | 29,243 | 42,813 | 41,686 | — | |||||||||||||||||||||||||||||||||
| Gross cumulative redundancy (deficiency) | 19,270 | 20,051 | 13,039 | 9,586 | 14,214 | 17,298 | 16,487 | 11,925 | 8,344 | 158 | — | |||||||||||||||||||||||||||||||||
14
Investments
NI Holdings’ investments in fixed income and equity securities are classified as available for sale and are carried at fair value with unrealized gains and losses reflected as a component of equity, net of income taxes. The goal of the Company’s investment activities is to complement and support its overall mission. As such, the investment portfolio is structured to maximize after-tax investment income and price appreciation while maintaining the portfolio’s target risk profile.
The Company’s overall investment objectives are (i) growth and preservation of capital, (ii) achieving favorable returns on invested assets through investment in high quality income producing assets, and (iii) assuring proper levels of liquidity to fund expected operating needs. See “Item 7A. Quantitative and Qualitative Information about Market Risk” for discussion about specific risks concerning investments.
In addition to any investments prohibited by the insurance laws and regulations of North Dakota and any other applicable states, NI Holdings’ investment policies prohibit the following investments and investing activities:
| · | commodities and futures contracts; |
| · | options (except covered call options); |
| · | non-investment grade debt obligations (determined at time of purchase); |
| · | interest only, principal only, and residual tranche collateralized mortgage obligations; |
| · | private placements; |
| · | foreign currency trading; |
| · | limited partnerships, other than publicly traded master limited partnerships; |
| · | convertible securities; |
| · | venture capital investments; |
| · | real estate properties; |
| · | securities lending; |
| · | portfolio leveraging (i.e., margin transactions); and |
| · | short selling. |
The Executive Committee of NI Holdings’ Board of Directors approves the Company’s investment policy and reviews it periodically. The investment portfolio is managed by Conning, Inc., Disciplined Growth Investors, and CIBC Personal Wealth Management.
The following table sets forth information concerning NI Holdings’ investments.
| December 31, | ||||||||||||||||
| 2018 | 2017 | |||||||||||||||
| Cost or Amortized Cost | Fair Value | Cost or Amortized Cost | Fair Value | |||||||||||||
| Fixed income securities: | ||||||||||||||||
| U.S. Government and agencies | $ | 19,183 | $ | 19,208 | $ | 9,531 | $ | 9,649 | ||||||||
| Obligations of states and political subdivisions | 52,782 | 52,698 | 81,741 | 82,595 | ||||||||||||
| Corporate securities | 95,290 | 94,142 | 88,474 | 89,451 | ||||||||||||
| Residential mortgage-backed securities | 50,902 | 50,283 | 28,557 | 28,524 | ||||||||||||
| Commercial mortgage-backed securities | 19,520 | 19,315 | 11,228 | 11,170 | ||||||||||||
| Asset-backed securities | 19,617 | 19,323 | 15,447 | 15,369 | ||||||||||||
| Total fixed income securities | 257,294 | 254,969 | 234,978 | 236,758 | ||||||||||||
| Equity securities | 38,139 | 48,498 | 29,028 | 47,561 | ||||||||||||
| Total | $ | 295,433 | $ | 303,467 | $ | 264,006 | $ | 284,319 | ||||||||
15
The amortized cost and estimated fair value of fixed income securities by contractual maturity are shown below as of December 31, 2018. Actual maturities could differ from contractual maturities because issuers of the securities may have the right to call or prepay certain obligations, which may or may not include call or prepayment penalties.
| December 31, 2018 | ||||||||
| Amortized Cost | Fair Value | |||||||
| Less than one year | $ | 12,490 | $ | 12,463 | ||||
| One through five years | 96,900 | 96,614 | ||||||
| Five through ten years | 52,128 | 51,351 | ||||||
| Greater than ten years | 5,737 | 5,620 | ||||||
| Mortgage/asset-backed securities | 90,039 | 88,921 | ||||||
| Total debt securities | $ | 257,294 | $ | 254,969 | ||||
At December 31, 2018, the average maturity of NI Holdings’ fixed income investment portfolio, excluding the Direct Auto portfolio, was 4.38 years and the average duration was 3.46 years. As a result, the fair value of investments may fluctuate significantly in response to changes in interest rates. In addition, NI Holdings may experience investment losses to the extent our liquidity needs require the disposition of fixed income securities in unfavorable interest rate environments.
NI Holdings uses quoted values and other data provided by independent pricing services as inputs in its process for determining fair values of its investments. The pricing services cover substantially all of the securities in the portfolio for which publicly quoted values are not available. The pricing services’ evaluations represent an exit price, which is a good faith opinion as to what a buyer in the marketplace would pay for a security in a current sale. The pricing is based on observable inputs either directly or indirectly, such as quoted prices in markets that are active, quoted prices for similar securities at the measurement date, or other inputs that are observable.
NI Holdings’ investment managers provide pricing information that they utilize, together with information obtained from independent pricing services, to determine the fair value of its fixed income securities. After a detailed review of the information obtained from the pricing services at December 31, 2018 and 2017, no adjustment was made to the values provided.
The following table sets forth our average cash and invested assets, net investment income, and return on average cash and invested assets for the reported periods:
| Year Ended December 31, | ||||||||||||
| 2018 | 2017 | 2016 | ||||||||||
| Weighted average cash and invested assets | $ | 337,407 | $ | 283,354 | $ | 203,412 | ||||||
| Gross investment income | $ | 8,384 | $ | 7,069 | $ | 5,460 | ||||||
| Investment expenses | 2,204 | 2,038 | 1,816 | |||||||||
| Net investment income | $ | 6,180 | $ | 5,031 | $ | 3,644 | ||||||
| Gross return on average cash and invested assets | 2.5% | 2.5% | 2.7% | |||||||||
| Net return on average cash and invested assets | 1.8% | 1.8% | 1.8% | |||||||||
A.M. Best Ratings
A.M. Best rates insurance companies based on factors of concern to policyholders. The rating evaluates the claims paying ability of a company, and is not a recommendation of the merits of an investment in our common stock, or the common stock of any other insurer.
Nodak Insurance and Battle Creek are rated “A” by A.M. Best, which is the third highest out of 15 possible ratings. A.M. Best has affirmed a stable financial strength outlook to both Nodak Insurance and Battle Creek. American West is rated “A-” with a stable financial strength outlook. Primero and Direct Auto are unrated because the nature of the non-standard auto business is not ratings sensitive. In its evaluation of a company, A.M. Best’s Credit Rating Methodology (“BCRM”) builds on a focus of balance sheet strength, operating performance, the business profile, and enterprise risk management. More specifically, the components of the BCRM include:
| · | the company’s profitability, leverage, and liquidity; |
| · | its book of business, product and geographic diversity, distribution channels, competition, and market position; |
16
| · | the quality and appropriateness of its reinsurance program; |
| · | the quality and management of its assets and liabilities; |
| · | the adequacy of its reserves and surplus; |
| · | its capital structure; |
| · | its pricing sophistication and data quality; |
| · | its regulatory, event, and product risks; |
| · | the experience and competence of its management; |
| · | its risk identification, management, appetite, and tolerances; and |
| · | its governance and risk culture. |
If we are unable to maintain at least an “A-” rating from A.M. Best, it may impair our ability to compete effectively.
Competition
The property casualty and crop insurance markets are highly competitive. NI Holdings competes with stock insurance companies, mutual companies, and other underwriting organizations. Our largest competitors in North Dakota for private passenger auto and homeowners are Progressive Casualty Insurance Company, State Farm Mutual Insurance Company, American Family Insurance, QBE Insurance Group, Farmers Union Mutual Insurance, and Auto-Owners Insurance. In South Dakota and Nebraska, we have small market shares and our competitors are the large national and regional companies as well as Farmers Mutual of Nebraska. Based on 2017 data, Nodak Insurance is the second largest writer of farmowners insurance in North Dakota. Our largest competitors are Farmers Union Mutual Insurance, North Star Mutual Insurance Company, and American Family Insurance. In Nebraska and South Dakota, we have a small farmowners market share, which is dominated by the large national and regional carriers. Certain of these competitors have substantially greater financial, technical, and operating resources than we do and may be able to offer lower rates or higher commissions to their producers.
Total industry-reported premiums written for multi-peril crop insurance in 2018 was $875,821 in North Dakota and $575,723 in Minnesota. In North Dakota, our multi-peril crop insurance direct premiums written were $37,374, $39,270, and $38,708 for the years ended December 31, 2018, 2017 and 2016, respectively. In Minnesota, our multi-peril crop insurance direct premiums written were $3,980, $4,534, and $3,504 for the years ended December 31, 2018, 2017 and 2016, respectively. NI Holdings wrote less than $500 in multi-peril crop insurance in Nebraska and South Dakota for each of the last three years. The principal competitors in our markets for multi-peril crop insurance are QBE Insurance Group, Chubb Corporation, Rural Community Insurance Services, CGB Enterprises, and Great American Insurance Group.
The premium rates for multi-peril crop insurance are established by the RMA, and, accordingly, we compete with other insurance companies on factors such as agency relationships, claim service, and market reputation in the crop insurance market. We believe that our relationship with the North Dakota Farm Bureau and our leading market share are significant factors in maintaining our market share of the crop insurance business in North Dakota.
With respect to writing property and casualty insurance, we compete on a number of factors such as pricing, agency relationships, policy support, claim service, and market reputation. Like other writers of property and casualty insurance, our policy terms vary from state to state based on the prescribed minimum liability limits in each state, as established by state law. We believe our company differentiates itself from many larger companies competing for this business by focusing on ease of doing business and providing excellent claims service with local, knowledgeable employees.
To compete successfully in the property and casualty insurance market, we rely on our ability to identify insureds that are most likely to produce an underwriting profit, operate with a disciplined underwriting approach, practice prudent claims management, reserve appropriately for unpaid claims, and provide quality service and competitive commissions to our independent and captive agents.
17
Regulation
General
We are subject to extensive regulation, particularly at the state level. The method, extent, and substance of such regulation varies by state, but generally has its source in statutes and regulations that establish standards and requirements for conducting the business of insurance and that delegate regulatory authority to state insurance regulatory agencies. In general, such regulation is intended for the protection of those who purchase or use insurance products, not the companies that write the policies. These laws and regulations have a significant impact on our business and relate to a wide variety of matters including accounting methods, agent and company licensure, claims procedures, corporate governance, examinations, investing practices, policy forms, pricing, trade practices, reserve adequacy, and underwriting standards.
State insurance laws and regulations require our insurance company subsidiaries to file financial statements with state insurance departments everywhere they do business, and the operations of such companies and their respective accounts are subject to examination by those departments at any time. Our insurance company subsidiaries prepare statutory-basis financial statements in accordance with accounting practices and procedures prescribed or permitted by the state in which they are domiciled. North Dakota generally conforms to National Association of Insurance Commissioners (“NAIC”) practices and procedures, so its examination reports and other filings generally are accepted by other states.
Premium rate regulation varies greatly among jurisdictions and lines of insurance. In the states in which our insurance company subsidiaries write insurance, premium rates for the various lines of insurance are subject to either prior approval or limited review upon implementation. The premium rates for multi-peril crop insurance are established by the RMA. See “Item 1. Business — Crop Insurance.”
Many jurisdictions have laws and regulations that limit an insurer’s ability to withdraw from a particular market. For example, states may limit an insurer’s ability to cancel or non-renew policies. Laws and regulations that limit cancellation and non-renewal may restrict our ability to exit unprofitable marketplaces in a timely manner.
Crop Insurance
The multi-peril crop insurance business is overseen by the federal government through the RMA. The RMA outlines policy language, establishes premium rates, and develops loss adjustment procedures for insurance programs under the federal crop insurance program. In addition, through the FCIC, the RMA provides premium subsidies to farmers and sets the commission percentages that can be paid to agents. All participating insurance carriers are subject to the same Standard Reinsurance Agreement (“SRA”), which outlines items such as reporting requirements and claims handling procedures, proportional and non-proportional reinsurance terms, and the level of administrative and operating reimbursement paid to insurers. The RMA also provides oversight to the approved insurance providers (“AIPs”). The AIPs are required to use the policies, premium rates, and loss adjustment procedures set by the RMA without modification and are required to issue a policy to any eligible applicant regardless of risk or profitability. The RMA conducts audits of AIPs with respect to claims and loss adjustment procedures.
American Agricultural Insurance Company is the AIP through which we issue multi-peril crop insurance policies, and is the holder of the SRA with the FCIC.
Examinations
Examinations are conducted every three to five years by the Departments of Insurance where the insurance companies are domiciled. Nodak Insurance and American West were last examined by the North Dakota Insurance Department as of December 31, 2016. The final examination report for American West included a finding related to intercompany expense charges between the two companies, which offset in consolidation. The underlying cause of this finding has been resolved.
Battle Creek was last examined by the Nebraska Insurance Department as of December 31, 2016, and the last examination of Primero by the Nevada Insurance Department was as of December 31, 2016. Neither examination resulted in any adjustments to their financial positions, nor were there any substantive matters raised in the final examination reports.
Direct Auto was last examined by the Illinois Department of Insurance as of December 31, 2017, for which an examination report has not yet been issued.
NAIC Risk-Based Capital Requirements
North Dakota and most other states have adopted the NAIC system of risk-based capital requirements that require insurance companies to calculate and report information under a risk-based formula. These risk-based capital requirements attempt to measure
18
statutory capital and surplus needs based on the risks in a company’s mix of products and investment portfolio. Under the formula, a company first determines its “authorized control level” risk-based capital. This authorized control level takes into account (i) the risk with respect to the insurer’s assets; (ii) the risk of adverse insurance experience with respect to the insurer’s liabilities and obligations; (iii) the interest rate risk with respect to the insurer’s business; and (iv) all other business risks and such other relevant risks as are set forth in the risk-based capital instructions. A company’s “total adjusted capital” is the sum of statutory capital and surplus and such other items as the risk-based capital instructions may provide. The formula is designed to allow state insurance regulators to identify weakly capitalized companies.
The requirements provide for four different levels of regulatory attention. The “company action level” is triggered if a company’s total adjusted capital is less than 2.0 times its authorized control level but greater than or equal to 1.5 times its authorized control level. At the company action level, the company must submit a comprehensive plan to the regulatory authority that discusses proposed corrective actions to improve the capital position. The “regulatory action level” is triggered if a company’s total adjusted capital is less than 1.5 times but greater than or equal to 1.0 times its authorized control level. At the regulatory action level, the regulatory authority will perform a special examination of the company and issue an order specifying corrective actions that must be followed. The “authorized control level” is triggered if a company’s total adjusted capital is less than 1.0 times but greater than or equal to 0.7 times its authorized control level. At this level, the regulatory authority may take action it deems necessary, including placing the company under regulatory control. The “mandatory control level” is triggered if a company’s total adjusted capital is less than 0.7 times its authorized control level. At this level, the regulatory authority is mandated to place the company under its control. The capital levels of our insurance company subsidiaries have never triggered any of these regulatory capital levels. We cannot guarantee, however, that the capital requirements applicable to such companies will not increase in the future.
NAIC Ratios
The NAIC has also developed a set of 13 financial ratios referred to as the Insurance Regulatory Information System (“IRIS”). Based on statutory-basis financial statements filed with state insurance regulators, the NAIC annually calculates these IRIS ratios to assist state insurance regulators in monitoring the financial condition of insurance companies. The NAIC has established an acceptable range for each of the IRIS financial ratios. If four or more of its IRIS ratios fall outside the range deemed acceptable by the NAIC, an insurance company may receive inquiries from individual state insurance departments. During each of the years ended December 31, 2018, 2017 and 2016, none of our insurance company subsidiaries produced results outside the acceptable range for more than three of the IRIS tests.
Enterprise Risk Assessment
In 2012, the NAIC adopted various changes to its Model Regulations, herein known as the “NAIC Amendments”. The NAIC Amendments, when adopted by the various states, are designed to respond to perceived gaps in the regulation of insurance holding company systems in the United States. The NAIC Amendments include a requirement that an insurance holding company system’s ultimate controlling person submit annually to its lead state insurance regulator an “enterprise risk report”. This enterprise risk report identifies the activities, circumstances, or events involving one or more affiliates of an insurer that, if not remedied properly, are likely to have a material adverse effect upon the financial condition or liquidity of the insurer or its insurance holding company system as a whole. While the NAIC Amendments have not been adopted in whole by the North Dakota Insurance Department, North Dakota currently requires insurers domiciled in North Dakota to include an enterprise risk assessment in its annual report. The NAIC Amendments also include provisions requiring a controlling person to submit prior notice to its domiciliary insurance regulator of its divestiture of control, having detailed minimum requirements for cost sharing and management agreements between an insurer and its affiliates, and expanding of the agreements between an insurer and its affiliates to be filed with its domiciliary insurance regulator.
In 2012, the NAIC also adopted the Own Risk Solvency Assessment (“ORSA”) Model Act. The ORSA Model Act, when adopted by the various states, will require an insurance holding company system’s chief risk officer to submit at least annually to its lead state insurance regulator a confidential report detailing its own internal solvency assessment. Such an assessment is to be tailored to the nature, scale, and complexity of an insurer. This assessment will include the material and relevant risks identified by the insurer associated with an insurer’s current business plan and the sufficiency of capital resources to support those risks. Although our insurance company subsidiaries are exempt from ORSA because of their size, NI Holdings intends to incorporate those elements of ORSA that it believes constitute “best practices” into its annual internal enterprise risk assessment.
Market Conduct Regulation
State insurance laws and regulations include numerous provisions governing trade practices and the marketplace activities of insurers, including provisions governing the form and content of disclosure to consumers, illustrations, advertising, sales practices, and complaint handling. State regulatory authorities generally enforce these provisions through periodic market conduct examinations.
19
Guaranty Fund Laws
All states have guaranty fund laws under which insurers doing business in the state can be assessed to fund policyholder liabilities of insolvent insurance companies. Under these laws, an insurer is subject to assessment depending upon its market share in the state of a given line of business. For the years ended December 31, 2018, 2017 and 2016, we paid no assessments pursuant to state insurance guaranty association laws, although we expect that Direct Auto may pay nominal assessments in the State of Illinois in the future. We establish reserves relating to insurance companies that are subject to insolvency proceedings when it becomes probable that we will be subject to an assessment and the amount of such assessment can be estimated. We cannot predict the amount and timing of any future assessments under these laws.
Federal Regulation
The U.S. federal government generally has not directly regulated the insurance industry except for certain areas of the market, such as insurance for crops, flood, nuclear, and terrorism risks. However, the federal government has undertaken initiatives or considered legislation in several areas that may affect the insurance industry, including tort reform, corporate governance, and the taxation of reinsurance companies. The Dodd-Frank Act established the Federal Insurance Office, which is authorized to study, monitor, and report to Congress on the insurance industry and to recommend that the Financial Stability Oversight Council designate an insurer as an entity posing risks to the U.S. financial stability in the event of the insurer’s material financial distress or failure. In December 2013, the Federal Insurance Office issued a report on alternatives to modernize and improve the system of insurance regulation in the United States, including by increasing national uniformity through either a federal charter or effective action by the states. Changes to federal legislation and administrative policies in several areas, including changes in federal taxation, can also significantly affect the insurance industry and us.
We are also subject to the Fair and Accurate Credit Transactions Act of 2003 (“FACTA”) and the Health Insurance Portability and Accountability Act of 1996 (“HIPAA”), both of which require us to protect the privacy of our customers’ information, including health and credit information.
Privacy
We are subject to numerous U.S. federal and state laws governing the collection, disclosure, and protection of personal and confidential information of our clients or employees. These laws and regulations are increasing in complexity and number, change frequently, and may conflict. Congress, state legislatures, and regulatory authorities are expected to consider additional regulation relating to privacy and other aspects of customer information.
As mandated by the Gramm-Leach-Bliley Act (“GLBA”), states have promulgated laws and regulations that require financial institutions, including insurance companies, to take steps to protect the privacy of certain consumer and customer information. The NAIC has adopted several provisions to facilitate the implementation of the GLBA, including the Privacy of Consumer Financial and Health Information Model Regulation and the Standards for Safeguarding Customer Information Model Regulation. Several states adopted similar provisions regarding the safeguarding of customer information. NI Holdings and its subsidiaries have implemented procedures to comply with the Gramm-Leach-Bliley Act’s related privacy requirements.
In October 2017, the NAIC adopted the Insurance Data Security Model Law (“IDSML”), which would require insurers, insurance producers, and other entities required to be licensed under state insurance laws to develop and maintain a written information security program, conduct risk assessments, oversee the data security practices of third-party service providers, and other related requirements. It is not clear whether, and to what extent, legislatures or insurance regulators in the states in which we, or our subsidiaries, operate will enact the IDMSL. Such enactments and regulations could raise compliance costs and subject us to the risk of regulatory enforcement actions, penalties, and reputational harm. Any such events could potentially have an adverse impact on our business, financial condition, or results of operations.
Office of Foreign Asset Control
The Treasury Department’s Office of Foreign Asset Control (“OFAC”) maintains a list of “Specifically Designated Nationals and Blocked Persons” (“the SDN List”). The SDN List identifies persons and entities that the government believes are associated with terrorists, rogue nations, or drug traffickers. OFAC’s regulations prohibit insurers, among others, from doing business with persons or entities on the SDN List. If the insurer finds and confirms a match, the insurer must take steps to block or reject the transaction, notify the affected person, and file a report with OFAC.
Jumpstart Our Business Startups Act of 2012
We are an emerging growth company (“EGC”), as defined in the Jumpstart Our Business Startups Act of 2012 (“the JOBS Act”), and we may take advantage of certain exemptions from various reporting requirements that are applicable to other public companies that are not emerging growth companies, such as reduced public company reporting, accounting, and corporate governance requirements. We currently intend to avail ourselves of the reduced disclosure obligations available under the JOBS Act.
20
Section 107 of the JOBS Act also provides that an EGC can take advantage of the extended transition period provided in Section 7(a)(2)(B) of the Securities Act for complying with new or revised accounting standards.
We will remain an EGC for up to five years following our initial public offering (“IPO”), or until the earliest of (i) the last day of the first fiscal year in which our annual gross revenue exceeds $1.07 billion, (ii) the date that we become a “large accelerated filer” as defined in Rule 12b-2 under the Securities Exchange Act of 1934, as amended (“the Exchange Act”), which would occur if the market value of our common stock that is held by non-affiliates exceeds $700 million as of the last business day of our most recently completed second fiscal quarter, or (iii) the date on which we have issued more than $1.07 billion in non-convertible debt during the preceding three year period.
Dividends
North Dakota law sets the maximum amount of dividends that may be paid by Nodak Insurance to NI Holdings during any twelve-month period after notice to, but without prior approval of, the North Dakota Insurance Department. This amount cannot exceed the lesser of (i) 10% of the insurance company’s surplus as regards policyholders as of the preceding December 31, or (ii) the insurance company’s statutory net income for the preceding calendar year (excluding realized capital gains), less any prior dividends paid during such twelve-month period. In addition, any insurance company other than a life insurance company may carry forward net income from the preceding two calendar years, not including realized capital gains, less any dividends actually paid during those two calendar years. As of December 31, 2018, the amount available for payment of dividends by Nodak Insurance in 2019 without the prior approval of the North Dakota Insurance Department is $17,588. “Extraordinary dividends” in excess of the foregoing limitations may only be paid with prior notice to, and approval of, the North Dakota Insurance Department.
Illinois law sets the maximum amount of dividends that may be paid by Direct Auto to NI Holdings during any twelve-month period after notice to, but without prior approval of, the Illinois Department of Insurance. This amount cannot exceed the greater of (i) 10% of the Company’s surplus as regards policyholders as of the preceding December 31, or (ii) the Company’s statutory net income for the preceding calendar year (excluding realized capital gains). As of December 31, 2018, the amount available for payment of dividends by Direct Auto in 2019 without the prior approval of the Illinois Department of Insurance is $6,653. Dividends in excess of this amount are considered “extraordinary” and are subject to the approval of the Illinois Department of Insurance.
See “Item 5. Market for the Registrant’s Common Equity, Related Stockholder Matters and Issuer Purchases of Equity Securities — Dividend Policy.”
Holding Company Laws
Most states, including North Dakota, have enacted legislation that regulates insurance holding company systems. Each insurance company in a holding company system is required to register with the insurance supervisory agency of its state of domicile and furnish certain information, including information concerning the operations of companies within the holding company group that may materially affect the operations, management, or financial condition of the insurers within the group. Pursuant to these laws, the North Dakota Insurance Department requires disclosure of material transactions involving an insurance company and its affiliates, and requires prior notice and/or approval of certain transactions, such as extraordinary dividends distributed by the insurance company. Under these laws, the North Dakota Insurance Department will have the right to examine us at any time.
All transactions within our consolidated group affecting our insurance company subsidiaries must be fair and equitable. Notice of certain material transactions between NI Holdings and any person or entity in our holding company system will be required to be given to the North Dakota Insurance Department. Certain transactions cannot be completed without the prior approval of the North Dakota Insurance Department.
Approval of the state insurance commissioner is required prior to any transaction affecting the control of an insurer domiciled in that state. In North Dakota, the acquisition of 10% or more of the outstanding voting securities of an insurer or its holding company is presumed to be a change in control. North Dakota law also prohibits any person or entity from (i) making a tender offer for, or a request or invitation for tenders of, or seeking to acquire or acquiring any voting security of a North Dakota insurer if, after the acquisition, the person or entity would be in control of the insurer, or (ii) effecting or attempting to effect an acquisition of control of or merger with a North Dakota insurer, unless the offer, request, invitation, acquisition, effectuation, or attempt has received the prior approval of the North Dakota Insurance Department.
Employees
As of December 31, 2018, NI Holdings and its subsidiaries had 178 total employees. None of these employees are covered by a collective bargaining agreement, and we believe that our employee relations are good.
21
| Item 1A. | Risk Factors |
An investment in the Company’s common shares involves certain risks. The following is a discussion of the most significant risks and uncertainties that may affect the Company’s business, financial condition, and future results.
Risks Related to Our Business and Industry
Catastrophic or other significant natural or man-made losses may negatively affect our financial condition and operating results.
As a property and casualty insurer, we are subject to claims from catastrophes that may have a significant negative impact on operating and financial results. We have experienced catastrophe losses, and can be expected to experience catastrophe losses in the future. Catastrophe losses can be caused by various events, including snow storms, ice storms, freezing temperatures, earthquakes, tornadoes, wind, hail, fires, and other natural or man-made disasters. The frequency, number, and severity of these losses are unpredictable. The extent of losses from a catastrophe is a function of both the total amount of insured exposure in the area affected by the event and the severity of the event.
Approximately 63.8% of NI Holdings’ consolidated direct premiums written in 2018 were written in North Dakota, compared to 71.2% in 2017. Because NI Holdings’ business is concentrated in North Dakota, adverse developments from severe weather events such as hailstorms, flooding, or droughts affecting a large portion of North Dakota would have a disproportionately greater effect on NI Holdings’ financial condition and results of operations than if its business were less geographically concentrated. The incidence and severity of such events are inherently unpredictable. In recent years, changing climate conditions have increased, and may continue to increase, the unpredictability, severity, and frequency of tornados and other storms, droughts, floods, and other extreme climatic events.
We attempt to reduce our exposure to catastrophe losses through the underwriting process and by obtaining reinsurance coverage. However, in the event that we experience catastrophe losses, we cannot assure you that our unearned premiums, liabilities for unpaid losses and LAE, and reinsurance will be adequate to cover these risks. In addition, because accounting rules do not permit insurers to reserve for catastrophic events until they occur, claims from catastrophic events could cause substantial volatility in our financial results for any fiscal quarter or year and could have a material adverse effect on our financial condition or results of operations. Our ability to write new business also could be adversely affected.
Our financial condition and results of operations also are affected periodically by losses caused by natural perils such as those described above that are not deemed a catastrophe. If a number of these events occur in a short time period, it may materially affect our financial condition and results of operations.
Any downgrade in our A.M. Best rating could affect our ability to write new business or renew our existing business, which would lead to a decrease in revenue and net income.
Third-party rating agencies, such as A.M. Best, periodically assess and rate the claims-paying ability of insurers based on criteria established by the rating agencies. Ratings assigned by A.M. Best are an important factor influencing the competitive position of insurance companies. A.M. Best ratings, which are reviewed at least annually, represent independent opinions of financial strength and ability to meet obligations to policyholders and are not directed toward the protection of investors. Therefore, our A.M. Best rating should not be relied upon as a basis for an investment decision to purchase our common stock.
Nodak Insurance holds a financial strength rating of “A” (Excellent) by A.M. Best, the third highest rating out of 15 rating classifications. Nodak Insurance has held an “A” rating since 2013. Our most recent rating by A.M. Best was issued on April 10, 2018. Battle Creek also holds an “A” rating and American West holds an “A-” rating. Financial strength ratings are used by producers and customers as a means of assessing the financial strength and quality of insurers. If our financial position deteriorates, we may not maintain our favorable financial strength rating from A.M. Best. A downgrade of our rating could severely limit or prevent us from writing desirable business or from renewing our existing business. In addition, a downgrade could negatively affect our ability to implement our strategy because it could cause our current or potential producers to choose other more highly rated competitors or reduce our ability to obtain reinsurance. See “Item 1. Business — A.M. Best Rating.”
A significant percentage of NI Holdings’ written premiums and net profits are generated from its multi-peril crop insurance business, and the loss of such business as a result of a termination of or substantial changes to the Federal crop insurance program would have a material adverse effect on our revenues and net income.
In 2018, 2017 and 2016, NI Holdings’ direst premiums written generated from its multi-peril crop insurance line of business were 18.5%, 22.6%, and 23.6%, respectively. Through the Federal Crop Insurance Corporation, the United States government subsidizes insurance companies by assuming an increasingly higher portion of losses incurred by farmers as a result of weather-related
22
and other perils as well as commodity price fluctuations. The United States government also subsidizes the premium cost to farmers for multi-peril crop yield and revenue insurance. Without this risk assumption, losses incurred by insurance companies would be higher. Without the premium subsidy, the number of farmers purchasing multi-peril crop insurance would decline significantly. Periodically, members of the United States Congress propose to reduce significantly the government’s involvement in the federal crop insurance program in an effort to reduce government spending. If legislation is adopted to reduce the amount of risk the government assumes, the amount of insurance premium subsidy provided to farmers or otherwise reduce the coverage provided under multi-peril crop insurance policies, losses would increase and purchases of multi-peril crop insurance could experience a significant decline nationwide and in our market area. Such changes could have a material adverse effect on our revenues and income.
Our results may fluctuate as a result of many factors, including cyclical changes in the insurance industry.
Results of companies in the insurance industry, and particularly the property and casualty insurance industry, historically have been subject to significant fluctuations and uncertainties and have fluctuated in cyclical periods of low premium rates and excess underwriting capacity resulting from increased competition (a so-called “soft market”), followed by periods of high premium rates and a shortage of underwriting capacity resulting from decreased competition (a so-called “hard market”). The industry’s profitability can be affected significantly by:
| · | estimates of rising levels of actual costs that are not known by companies at the time they price their products; |
| · | volatile and unpredictable developments, including man-made and natural catastrophes; |
| · | changes in reserves resulting from the general claims and legal environments as different types of claims arise and judicial interpretations relating to the scope of insurers’ liability develop; and |
| · | fluctuations in interest rates, inflationary pressures and other changes in the investment environment, which affect returns on invested capital and may affect the ultimate payout of losses. |
Fluctuations in underwriting capacity, demand and competition, and the impact on our business of the other factors identified above, could have a negative impact on our results of operations and financial condition. Based on our analysis of the underwriting capacity and price competition in the current market, we believe that we are generally in a stable phase of the insurance industry cycle. If other insurers seek to expand the kinds or amounts of insurance coverage they offer, this could result in increased underwriting capacity and competition and declining pricing as some insurers seek to maintain market share at the expense of underwriting discipline.
Competition for potential acquisitions from other property and casualty insurers could increase the price that NI Holdings will be required to pay in connection with future acquisitions.
Over-capacity in the property and casualty market has led other market participants to seek acquisitions in order to generate revenue growth. These market conditions may cause significant competition for acquisitions and increase the price for acquisitions. This competitive market could impede execution of NI Holdings’ external growth strategy.
Integration of existing businesses and future acquisitions may require a significant investment of management’s time and distract management from the day-to-day operations of NI Holdings’ business.
NI Holdings previously spent considerable time and effort integrating Battle Creek and Primero in the areas of sales and marketing, operations, financial reporting, and employee benefits. Direct Auto and future acquisitions will require additional integration, particularly to realize the anticipated coordination designed to drive revenue growth, reduce costs, and ensure operational efficiency and compliance. NI Holdings’ management staff is small, and there can be no assurance that acquisitions will be successfully executed and integrated in a timely manner.
We may not be able to manage our growth effectively.
We intend to grow our business in the future, which could require additional capital, systems development, and skilled personnel. We cannot assure you that we will be able to locate profitable business opportunities, meet our capital needs, expand our systems and our internal controls effectively, allocate our human resources optimally, identify qualified employees or agents, or incorporate effectively the components of any businesses we may acquire in our effort to achieve growth. The failure to manage our growth effectively and maintain underwriting discipline could have a material adverse effect on our business, financial condition, and results of operations.
23
We may not be able to grow our business if our insurance company subsidiaries cannot maintain and grow their agent relationships, or if consumers seek other distribution methods offered by our competitors.
Our ability to retain existing agents, and to attract new agents, is essential to the continued growth of our business. If independent agents find it easier to do business with our competitors, our agent base may erode and, as a result, be unable to retain existing business or generate sufficient new business. While we believe that we have good relationships with our independent agents, we cannot be certain that these agents will continue to sell our products instead of our competitors’ products.
While our products are sold through either independent or captive agents, our competitors may sell insurance through other delivery models, including the internet, direct marketing, or other emerging alternative distribution methods. To the extent that current and potential policyholders change their insurance shopping preferences, this may have an adverse effect on our ability to grow, our financial position, and our results of operations.
Our success depends on the ability of our insurance company subsidiaries to underwrite risks accurately and to price our commercial and personal lines insurance products accordingly.
The nature of the insurance business is such that pricing must be determined before the underlying costs are fully known. This requires significant reliance on estimates and assumptions in setting prices. If our insurance subsidiaries fail to assess accurately the risks that they assume in our commercial and personal lines products, they may fail to charge adequate premium rates, which could affect our profitability and have a material adverse effect on our financial condition, results of operations, or cash flows. Their ability to assess their policyholder risks and to price their products accurately is subject to a number of risks and uncertainties, including, but not limited to:
| · | competition from other providers of property and casualty insurance; |
| · | price regulation by insurance regulatory authorities; |
| · | selection and implementation of appropriate rating formulae or other pricing methodologies; |
| · | availability of sufficient reliable data; |
| · | uncertainties inherent in estimates and assumptions generally; |
| · | adverse changes in claim results; |
| · | incorrect or incomplete analysis of available data; |
| · | our ability to accurately predict policyholder retention, investment yields, and the duration of liability for losses and LAE; and |
| · | unanticipated effects of court decisions, legislation, or regulation, including those related to legal liability for damages by our insureds. |
These risks and uncertainties could cause our insurance subsidiaries to underprice their policies, which would negatively affect their results of operations, or to overprice their policies, which could reduce their competitiveness. Either such event could have a material adverse effect on their financial condition, results of operations, and cash flows.
Under the federal crop insurance program, each insurer is required to accept every application for multi-peril crop insurance that they receive, and the premiums and the policy terms are set by the RMA, which is the federal government agency administering the federal crop insurance program. Accordingly, no policy underwriting is necessary in connection with our multi-peril crop insurance line of business. We, and several other crop insurers, rely on AFBIS to underwrite our crop hail insurance line of business. Unlike the multi-peril crop business, however, we have the ability to decline to issue any crop hail insurance policy if we believe the policy will expose us to too much risk in a particular geographic area or if we are unwilling to insure the crop that the policy would cover. If we accept the application for crop hail insurance, however, we could incur losses if AFBIS fails to adequately underwrite and price such coverage.
Our results and financial condition may be affected by a failure to establish adequate liabilities for unpaid losses and LAE or by adverse development of prior year reserves.
NI Holdings maintains reserves to cover amounts it estimates will be needed to pay for unpaid losses and for the expenses necessary to settle insured claims. Estimating liabilities for unpaid losses and LAE is a difficult and complex process involving many variables and subjective judgments. The liability for unpaid losses and LAE is the largest liability of NI Holdings and represents the financial statement item most sensitive to estimation and judgment. In developing its estimates of unpaid losses and LAE, NI
24
Holdings has evaluated and considered actuarial projection techniques based on its assessment of facts and circumstances then known, historical loss experience data, and estimates of anticipated trends. This process assumes that past experience, adjusted for the effects of current developments, changes in operations, and anticipated trends, constitutes an appropriate basis for predicting future events. While NI Holdings believes that its liability for unpaid losses and LAE is appropriate, to the extent that such reserves prove to be inadequate or excessive in the future, we would adjust them and incur a charge or credit to earnings, as the case may be, in the period the reserves are adjusted. Any such adjustment could have a material impact on our financial condition and results of operations. There can be no assurance that the estimates of such liabilities will not change in the future. For additional information on our liability for unpaid losses and LAE, see “Item 7. Management’s Discussion and Analysis of Financial Condition and Results of Operations.”
We rely on our systems and employees, and those of certain third-party vendors and service providers, in conducting our operations, and certain failures, including internal or external fraud, operational errors, systems malfunctions, or cyber-security incidents, could materially adversely affect our operations.
We are exposed to many types of operational risk, including the risk of fraud by employees and outsiders, clerical and recordkeeping errors, and computer or telecommunications systems malfunctions. Our business depends on our ability to process a large number of increasingly complex transactions. If any of our operational, accounting, or other data processing systems fail or have other significant shortcomings, we could be materially adversely affected. Similarly, we depend on our employees. We could be materially adversely affected if one or more of our employees cause a significant operational breakdown or failure, either as a result of human error or intentional sabotage or fraudulent manipulation of our operations or systems.
Third parties with whom we do business, including vendors that provide services or security solutions for our operations, could also be sources of operational and information security risk to us, including from breakdowns, failures, or capacity constraints of their own systems or employees. While we attempt to manage the informational and operational risks that arise from our use of third party providers by reviewing and assessing such providers’ cybersecurity controls, as appropriate, we cannot assure that our attempts to do so will always be successful. Any problems caused by third party providers could diminish our ability to operate our business, or cause financial loss, potential liability to insureds, inability to secure insurance, reputational damage, or regulatory intervention, which could materially adversely affect us.
We rely heavily on our operating systems in connection with issuing policies, paying claims, and providing the information we need to conduct our business. We also rely on the operating systems of AFBIS in connection with various processes with respect to our multi-peril crop line of business. We may be subject to disruptions of such operating systems arising from events that are wholly or partially beyond our control, which may include, for example, electrical or telecommunications outages, natural or man-made disasters, such as earthquakes, floods or tornados, or events arising from terrorist acts. Such disruptions may give rise to losses in service to insureds and loss or liability to us. In addition, there is the risk that our controls and procedures as well as our business continuity, disaster recovery, and data security systems prove to be inadequate. The computer systems and network systems others and we use could be vulnerable to unforeseen problems. These problems may arise in both our internally developed systems and the systems of third-party service providers. In addition, our computer systems and network infrastructure present security risks and could be susceptible to hacking, computer viruses, or data breaches. Any such failure could affect our operations and could materially adversely affect our results of operations by requiring us to expend significant resources to correct the defect, as well as by exposing us to litigation or losses not covered by insurance. Although we have business continuity plans and other safeguards in place, our business operations may be adversely affected by significant and widespread disruption to our physical infrastructure or operating systems and those of third-party service providers that support our business. As we continue to expand internet and mobile strategies and to build and maintain an integrated digital enterprise, these risks are likely to increase.
Our operations rely on the secure processing, transmission, and storage of confidential information in our computer systems and networks. Our technologies, systems, and networks may become the target of cyber-attacks or information security breaches that could result in the unauthorized release, gathering, monitoring, misuse, loss or destruction of our or our insureds’ confidential, proprietary and other information, or otherwise disrupt our or our insureds’ or other third parties’ business operations, which in turn may result in legal claims, regulatory scrutiny and liability, reputational damage, the incurrence of costs to eliminate or mitigate further exposure, and the loss of customers. Although to date we have not experienced any material losses relating to cyber-attacks or other information security breaches, there can be no assurance that we will not suffer such losses in the future. Our risk and exposure to these matters remains heightened because of, among other things, the evolving nature and increasing frequency and sophistication of these threats and the outsourcing of some of our business operations. As a result, cyber-security and the continued development and enhancement of our controls, processes, and practices designed to protect our systems, computers, software, data, and networks from attack, damage, or unauthorized access remain a priority. As cyber-threats continue to evolve, we may be required to expend significant additional resources to continue to modify or enhance our protective measures or to investigate and remediate any information security vulnerabilities.
Disruptions or failures in the physical infrastructure or operating systems that support our business and customers, or cyber-attacks or security breaches of the networks, systems, or devices that our customers use to access our products and services could result in customer attrition, reputational damage, reimbursement or other compensation costs, and/or additional compliance costs, any of which could materially adversely affect our financial condition or results of operations.
25
The compromise of personal, confidential or proprietary information could also subject us to legal liability or regulatory action, including fines, penalties or intervention, under evolving cyber-security, data protection and privacy laws and regulations enacted by the U.S. federal and state governments. Such laws and regulations have become increasingly widespread and demanding in recent years. As noted above, in October 2017, the NAIC adopted the IDSML, which would require insurers and other regulated insurance entities to comply with detailed information security obligations. Enactment of the IDSML or similar statute by the legislatures of the states in which we or our subsidiaries operate may result in increased compliance costs and the risk of regulatory enforcement actions and penalties. If incurred, such regulatory penalties could harm our reputation. Any such events could have an adverse impact on our business, financial condition or results of operations.
Our revenues and financial results may fluctuate with interest rates, investment results, equity market fluctuations, and developments in the securities markets.
NI Holdings invests the premiums it receives from policyholders until cash is needed to pay insured claims or other expenses. Investment securities represent one of the largest categories of assets of NI Holdings. The fair value of its investment holdings is affected by general economic conditions, and changes in the financial and credit markets. NI Holdings relies on the investment income produced by its investment portfolio to contribute to its profitability. Changes in interest rates and credit quality may result in fluctuations in the income derived from, the valuation of, and in the case of declines in credit quality, payment defaults on our fixed income securities. Such conditions could give rise to significant realized and unrealized investment losses or the impairment of securities whose decreases in value are deemed other-than-temporary.
The Company continues to allocate a portion of its investment portfolio to equity securities, as we believe the long-term investment returns remain attractive. These securities are subject to general economic conditions, specific industry dynamics, and individual company financial results. Recent history has also demonstrated that these securities are subject to short-term market fluctuations, more so than fixed income securities. Effective January 1, 2019, the changes in the market values of our equity securities will be recorded as a component of our net income. In the past, these changes, along with the corresponding changes in our fixed income securities, were recorded, net of income taxes, in other comprehensive income. This accounting standard change will create an increased level of volatility in our reported operating results going forward and may distract from the long-term investment philosophy that we currently employ.
Any significant or long-running negative changes in the fixed income or equity markets could have a material adverse effect on our financial condition, results of operations, or cash flows. The investment portfolio of NI Holdings is also subject to credit and cash flow risk, including risks associated with its investments in asset-backed and mortgage-backed securities. Because the Company’s investment portfolio is the largest component of its assets and a multiple of its equity, adverse changes in economic conditions could result in other-than-temporary impairments that are material to our financial condition and operating results. Such economic changes could arise from overall changes in the financial markets or specific changes to industries, companies, or municipalities in which we maintain investment holdings. See “Item 7. Quantitative and Qualitative Information about Market Risk.”
Any acquisitions we make could disrupt our business and harm our financial condition or results of operations.
As part of our growth strategy, we will continue to evaluate opportunities to acquire other property and casualty insurers and insurance-related fee income businesses. Acquisitions that we may make or implement in the future entail a number of risks that could materially adversely affect our business and operating results, including:
| · | problems integrating the acquired operations with our existing business; |
| · | operating and underwriting results of the acquired operations not meeting our expectations; |
| · | diversion of management’s time and attention from our existing business; |
| · | need for financial resources above our planned investment levels; |
| · | difficulties in retaining business relationships with agents and policyholders of the acquired company; |
| · | risks associated with entering markets in which we lack extensive prior experience; |
| · | tax issues associated with acquisitions; |
| · | acquisition-related disputes, including disputes over contingent consideration and escrows; |
| · | potential loss of key employees of the acquired company; and |
| · | potential impairment of related goodwill and intangible assets. |
26
We could be adversely affected by the loss of our existing management or key employees.
The success of our business is dependent, to a large extent, on our ability to attract and retain key employees, in particular our senior officers. Our business may be adversely affected if labor market conditions make it difficult for us to replace our current key officers with individuals having equivalent qualifications and experience at compensation levels competitive for our industry. Our key officers include:
| · | Michael J. Alexander, our President and Chief Executive Officer; |
| · | Brian R. Doom, our Executive Vice President and Chief Financial Officer; and |
| · | Patrick W. Duncan, our Vice President of Operations. |
These key officers have extensive experience in the property and casualty and crop insurance industry. Our employment and other agreements with our key officers do not include covenants not to compete or non-solicitation provisions because they are unenforceable under North Dakota law.
Our ability to manage our exposure to underwriting risks depends on the availability and cost of reinsurance coverage.
Reinsurance is the practice of transferring part of an insurance company’s liability and premium under an insurance policy to another insurance company. NI Holdings uses reinsurance arrangements to limit and manage the amount of risk it retains, to stabilize its underwriting results, and to increase its underwriting capacity. The availability and cost of reinsurance are subject to current market conditions and may vary significantly over time. Any decrease in the amount of reinsurance maintained will increase our risk of loss. We may be unable to maintain our desired reinsurance coverage or to obtain other reinsurance coverage in adequate amounts and at favorable rates. If we are unable to renew the current coverage maintained by NI Holdings or obtain new coverage, it may be difficult for us to manage our underwriting risks and operate our business profitably.
If our reinsurers do not pay our claims in accordance with our reinsurance agreements, we may incur losses.
We are subject to loss and credit risk with respect to the reinsurers with whom NI Holdings deals because buying reinsurance does not relieve us of our liability to policyholders. If such reinsurers were not capable of fulfilling their financial obligations to us, our insurance losses would increase. NI Holdings secures reinsurance coverage from a number of reinsurers. The lowest A.M. Best rating issued to any of our current reinsurers is “A-” (Excellent), which is the fourth highest of fifteen ratings. See “Item 1. Business — Reinsurance.”
If we fail to comply with insurance industry regulations, or if those regulations become more burdensome, we may not be able to operate profitably.
Nodak Insurance and American West are currently regulated by the North Dakota Insurance Department. Battle Creek is regulated by the Nebraska Insurance Department. Primero is regulated by the Nevada Insurance Department. Direct Auto is regulated by the Illinois Department of Insurance. All five companies are also subject to regulation, to a more limited extent, by the insurance departments of other states in which they do business. The failure to comply with the laws and regulations of each jurisdiction could subject NI Holdings to sanctions and fines, including the cancellation or suspension of its license. Because approximately 63.8% of our 2018 consolidated direct premiums written originate from business written in North Dakota, the cancellation or suspension of our license in North Dakota, as a result of any failure to comply with the applicable insurance laws and regulations, would result in the most severe impact on our financial condition and results of operations.
Most insurance regulations are designed to protect the interests of policyholders rather than shareholders and other investors. These regulations relate to, among other things:
| · | approval of policy forms and premium rates; |
| · | standards of solvency, including establishing requirements for minimum capital and surplus, and for risk-based capital; |
| · | classifying assets as admissible for purposes of determining solvency and compliance with minimum capital and surplus requirements; |
| · | licensing of insurers and their producers; |
| · | advertising and marketing practices; |
27
| · | restrictions on the nature, quality, and concentration of investments; |
| · | assessments by guaranty associations and mandatory pooling arrangements; |
| · | restrictions on the ability to pay dividends; |
| · | restrictions on transactions between affiliated companies; |
| · | restrictions on the size of risks insurable under a single policy; |
| · | requiring deposits for the benefit of policyholders; |
| · | requiring certain methods of accounting; |
| · | periodic examinations of our operations and finances; |
| · | claims practices; |
| · | prescribing the form and content of reports of financial condition required to be filed; and |
| · | requiring reserves for unearned premiums, losses and other purposes. |
State insurance departments also conduct periodic examinations of the affairs of insurance companies and require the filing of annual and other reports relating to financial condition, holding company issues, and other matters. These regulatory requirements may adversely affect or inhibit our ability to achieve some or all of our business objectives. The last examination of both Nodak Insurance and American West by the North Dakota Insurance Department was as of December 31, 2016. The last examination of Battle Creek by the Nebraska Insurance Department was as of December 31, 2016, and the last examination by the Nevada Insurance Department of Primero was as of December 31, 2016. The last examination of Direct Auto by the Illinois Department of Insurance was as of December 31, 2017.
In addition, regulatory authorities have relatively broad discretion to deny or revoke licenses for various reasons, including the violation of regulations. Further, changes in the level of regulation of the insurance industry or changes in laws or regulations themselves or interpretations by regulatory authorities could adversely affect our ability to operate our business.
We could be adversely affected by any interruption to our ability to conduct business at our current location.
Our business operations could be substantially interrupted by flooding, snow, ice, and other weather-related incidents, or from fire, power loss, telecommunications failures, terrorism, or other such events. In such an event, we may not have sufficient redundant facilities to cover a loss or failure in all aspects of our business operations and to restart our business operations in a timely manner. Any damage caused by such a failure or loss may cause interruptions in our business operations that may adversely affect our service levels and business. See “Item 1. Business — Technology.”
Assessments and premium surcharges for state guaranty funds and other mandatory pooling arrangements may reduce our profitability.
Most states require insurance companies authorized to do business in their state to participate in guaranty funds, which require the insurance companies to bear a portion of the unfunded obligations of impaired, insolvent, or failed insurance companies. These obligations are funded by assessments, which are expected to continue in the future. State guaranty associations levy assessments, up to prescribed limits, on all insurance companies doing business in the state based on their proportionate share of premiums written in the lines of business in which the impaired, insolvent, or failed insurance companies are engaged. Accordingly, the assessments levied on us may increase as we increase our written premiums. See “Item 1. Business — Regulation.”
In addition, as a condition to conducting business in some states, insurance companies are required to participate in residual market programs to provide insurance to those who cannot procure coverage from an insurance carrier on a negotiated basis. Insurance companies generally can fulfill their residual market obligations by, among other things, participating in a reinsurance pool where the results of all policies provided through the pool are shared by the participating insurance companies. Although we price our insurance to account for our potential obligations under these pooling arrangements, we may not be able to accurately estimate our liability for these obligations. Accordingly, mandatory pooling arrangements may cause a decrease in our profits. As we write policies in new states that have mandatory pooling arrangements, we will be required to participate in additional pooling arrangements. Further, the impairment, insolvency, or failure of other insurance companies in these pooling arrangements would likely increase the liability for other members in the pool. The effect of assessments and premium surcharges or increases in such assessments or surcharges could reduce our profitability in any given period or limit our ability to grow our business. See “Item 7. Management’s Discussion and Analysis of Financial Condition and Results of Operations.”
28
Future changes in financial accounting standards or practices may adversely affect our reported results of operations.
Financial accounting standards in the United States are constantly under review and may be changed from time to time. We would be required to apply these changes when adopted. Once implemented, these changes could materially affect our financial condition and results of operations and/or the way in which such financial condition and results of operations are reported.
Similarly, we are subject to taxation in the United States and a number of state jurisdictions. Rates of taxation, definitions of income, exclusions from income, and other tax policies are subject to change over time. Accounting standards would require that we recognize the effects of changes in tax rates and laws on deferred income tax balances in the period in which the legislation is enacted.
Enactment of significant income tax laws may adversely affect our reported results of operations.
On December 22, 2017, the Tax Cuts and Jobs Act (the “TCJA”) was signed into law, significantly reforming the U.S. Internal Revenue Code. The TCJA, among other things, includes changes to U.S. federal income tax rates, imposes significant additional limitations on the deductibility of interest, allows for increased expensing of capital expenditures, puts into effect the migration from a “worldwide” system of taxation to a territorial system, and modifies or repeals many business deductions and credits. We have incorporated all material impacts into our estimates of tax liabilities, but we will continue to evaluate the effect of the TCJA on our projection of cash flows and our net operating results. The estimated impact of the TCJA is based on our management’s current knowledge and assumptions and recognized impacts could be materially different from current estimates based on our actual results and further guidance released on the new law. Additional impacts of the TCJA on holders of common shares is uncertain and could be adverse. This Form 10-K does not discuss any such tax legislation or the manner in which it might affect purchasers of common shares. We urge our stockholders, including purchasers of common shares, to consult with their own legal and tax advisors with respect to such legislation and the potential tax consequences of investing in common shares.
We face uncertainties related to the effectiveness of internal controls, particularly with regard to our operating subsidiaries’ financial reporting controls and information technology security.
It should be noted that any system of internal controls, however well designed and operated, can provide only reasonable, and not absolute, assurance that the objectives of the system are met. In addition, the design of any internal control system is based in part upon certain assumptions about the likelihood of future events. Because of these and other inherent limitations of internal control systems, there can be no assurance that any design will achieve its stated goal under all potential future conditions, regardless of how remote. Deficiencies or weaknesses that are not yet identified could emerge, and the identification and correction of these deficiencies or weaknesses could have a material impact on our results of operations.
We will be required to publicly report on deficiencies or weaknesses in our internal controls that meet a materiality standard. Management may, at a point in time, categorize a deficiency or weakness as immaterial or minor and therefore not be required to publicly report such deficiency or weakness. Such determination, however, does not preclude a change in circumstances such that the deficiency or weakness could, at a later time, become a reportable condition that could have a material impact on our results of operations.
Risks Related to Our Common Stock
Our return on equity may be low compared to other insurance companies. A low return could lower the trading price of our common stock.
Net income divided by average equity, known as “return on equity,” is a ratio many investors use to compare the performance of an insurance company to its peers. Our return on equity is expected to be reduced due to the large amount of capital that we raised in our initial public offering that has yet to be deployed, expenses we will incur in pursuing our growth strategies, the costs of being a public company, and added expenses associated with our employee stock ownership plan (“ESOP”) and equity incentive plans. Until we can increase our earned premiums and net income, we expect our return on equity to be below the median return on equity for publicly traded insurance companies, which may negatively affect the value of our common stock.
Additional expenses from new stock-based benefit plans will adversely affect our profitability.
Our shareholders have approved the adoption of an equity incentive plan (“the Plan”). Under the Plan, we may award participants restricted shares of our common stock, options to purchase shares of our common stock, or other forms of awards. Restricted stock awards will be made at no cost to the participants. The maximum number of shares of common stock that may be issued is set forth in the Plan.
The additional compensation expense resulting from the ESOP and the Plan will adversely affect our profitability. We cannot determine the actual future amount of these new stock-related compensation and benefit expenses at this time because applicable accounting practices require that they be based on the fair market value of the shares of common stock at specific points in the future; however, we expect them to be material. We will recognize expenses for our ESOP when shares are committed to be
29
released to participants’ accounts and will recognize expenses for restricted stock awards and stock options over the vesting period of awards made to recipients. See our consolidated financial statements for the actual amount of expenses to date.
Nodak Mutual Group’s majority control of our common stock will enable it to exercise voting control over most matters put to a vote of shareholders and will prevent shareholders from forcing a sale or a second-step conversion transaction you may find advantageous.
Nodak Mutual Group owns a majority of our outstanding common stock and, through its Board of Directors, is able to exercise voting control over most matters put to a vote of shareholders. The votes cast by Nodak Mutual Group may not be in your personal best interests as a shareholder. For example, Nodak Mutual Group may exercise its voting control to defeat a shareholder nominee for election to the Board of Directors of NI Holdings. Moreover, Nodak Mutual Group’s ability to elect the Board of Directors of NI Holdings restricts the ability of the minority shareholders of NI Holdings to effect a change of control of management. Some shareholders may desire a sale or merger transaction, since shareholders typically receive a premium for their shares, or a second-step conversion transaction, since fully converted institutions tend to trade at higher multiples than mutual holding companies.
Our status as an insurance holding company with no direct operations could adversely affect our ability to fund operations, conduct future share repurchases, or meet our debt obligations.
We are an insurance holding company. A significant source of funds available to us for the payment of operating expenses, share repurchases, and debt-related amounts are net proceeds from our initial public offering retained at the holding company, management fees, and dividends from our subsidiaries. The payment of dividends by Nodak Insurance to NI Holdings will be restricted by North Dakota’s insurance law. American West and Primero historically have not paid dividends to Nodak Insurance, but would be restricted by laws in the domiciliary states. The payment of dividends by Direct Auto to NI Holdings will be restricted by Illinois’ insurance law.
Statutory provisions and provisions of our Articles of Incorporation and Bylaws may discourage takeover attempts of NI Holdings that you may believe are in your best interests or that might result in a substantial profit to you.
We are subject to provisions of North Dakota corporate and insurance law that hinder a change of control. North Dakota law requires the North Dakota Insurance Department’s prior approval of a change of control of an insurance holding company. Under North Dakota law, the acquisition of 10% or more of the outstanding voting stock of an insurer or its holding company is presumed to be a change in control. Approval by the North Dakota Insurance Department may be withheld even if the transaction would be in the shareholders’ best interest if the North Dakota Insurance Department determines that the transaction would be detrimental to policyholders.
Our Articles of Incorporation and Bylaws also contain provisions that may discourage a change in control. These provisions include:
| · | a prohibition on a person, including a group acting in concert, other than Nodak Mutual Group, from acquiring voting control of more than 10% of our outstanding stock without prior approval of our Board of Directors; |
| · | a classified Board of Directors divided into three classes serving for successive terms of three years each; |
| · | the prohibition of cumulative voting in the election of directors; |
| · | the requirement that nominations for the election of directors made by shareholders and any shareholder proposals for inclusion on the agenda at any shareholders’ meeting must be made by notice (in writing) delivered or mailed to us not less than 90 days prior to the meeting; |
| · | the prohibition of shareholders’ action without a meeting (except for actions taken by Nodak Mutual Group) and of shareholders’ right to call a special meeting; |
| · | the requirement imposing a mandatory tender offer requirement on a shareholder other than Nodak Mutual Group that has a combined voting power of 35% or more of the votes that our shareholders are entitled to cast, unless acquisition of such voting power by such shareholder was approved by our Board of Directors; |
| · | the requirement that the foregoing provisions of our Articles of Incorporation can only be amended by an affirmative vote of shareholders entitled to cast at least 80% of all votes that shareholder are entitled to cast, unless approved by an affirmative vote of at least 80% of the members of the Board of Directors; and |
| · | the requirement that certain provisions of our Bylaws can only be amended by an affirmative vote of shareholders entitled to cast at least 66 2/3%, or in certain cases 80%, of all votes that shareholders are entitled to cast. |
30
These provisions may serve to entrench management and may discourage a takeover attempt that you may consider to be in your best interest or in which you would receive a substantial premium over the current market price. These provisions may make it extremely difficult for any one person, entity, or group of affiliated persons or entities to acquire voting control of NI Holdings, with the result that it may be extremely difficult to bring about a change in the Board of Directors or management. Some of these provisions also may perpetuate present management because of the additional time required to cause a change in the control of the Board of Directors. Other provisions make it difficult for shareholders owning less than a majority of the voting stock to be able to elect even a single director.
Ownership of a majority of our stock by Nodak Mutual Group will make removal of the management difficult.
Nodak Mutual Group owns greater than 55% of our outstanding common stock. Therefore, it has the power to take actions that nonaffiliated shareholders may deem to be contrary to the shareholders’ best interests. In addition, certain provisions of our Articles of Incorporation, such as the existence of a classified Board of Directors, the prohibition of cumulative voting for the election of directors, and the prohibition on any person or group acquiring and having the right to vote in excess of 10% of our outstanding stock without the prior approval of the Board of Directors will make removal of NI Holdings’ management difficult.
If our subsidiaries are not sufficiently profitable, our ability to pay dividends will be limited.
We are a separate entity with no operations of our own other than holding the common stocks of Nodak Insurance, Direct Auto, and our other subsidiaries. We depend primarily on dividends paid by Nodak Insurance and Direct Auto, and the proceeds from our initial public offering that were not contributed to Nodak Insurance, to carry out our business plan, including future acquisitions, and to provide funds for the payment of dividends. To date, neither Nodak Insurance nor Direct Auto have paid any dividends.
We will receive dividends from Nodak Insurance only after all of Nodak Insurance’s obligations and regulatory requirements with the North Dakota Insurance Department have been satisfied. North Dakota law sets the maximum amount of dividends that may be paid by Nodak Insurance during any twelve-month period after notice to, but without prior approval of, the North Dakota Insurance Department. This amount cannot exceed the lesser of (i) 10% of the insurance company’s surplus as regards policyholders as of the preceding December 31, or (ii) the insurance company’s statutory net income for the preceding calendar year (excluding realized capital gains), less any prior dividends paid during such twelve-month period.
Illinois law sets the maximum amount of dividends that may be paid by Direct Auto during any twelve-month period after notice to, but without prior approval of, the Illinois Department of Insurance. This amount cannot exceed the greater of (i) 10% of the Company’s surplus as regards policyholders as of the preceding December 31, or (ii) the Company’s statutory net income for the preceding calendar year (excluding realized capital gains).
In addition, in the state of North Dakota, any insurance company other than a life insurance company may carry forward net income from the preceding two calendar years, not including realized capital gains, less any dividends actually paid during those two calendar years. If Nodak Insurance and Direct Auto are not sufficiently profitable, our ability to pay dividends to you in the future will be limited.
We are an “emerging growth company” and have elected to comply with reduced public company reporting requirements.
We are an EGC as defined by the JOBS Act. For as long as we continue to be an EGC, we may choose to take advantage of exemptions from various public company reporting requirements. These exemptions include, but are not limited to, (i) not being required to comply with the auditor attestation requirements of Section 404 of SOX, (ii) reduced disclosure obligations regarding executive compensation in our periodic reports, proxy statements, and registration statements, and (iii) exemptions from the requirements of holding a nonbinding advisory vote on executive compensation and shareholder approval of any golden parachute payments not previously approved. In this Annual Report on Form 10-K, we have elected to take advantage of certain of the reduced disclosure obligations regarding financial statements and executive compensation. In addition, Section 107(b) of the JOBS Act provides that an EGC can take advantage of the extended transition period provided in Section 7(a)(2)(B) of the Exchange Act for complying with new or revised accounting standards. In other words, an EGC can delay the adoption of certain accounting standards until those standards would otherwise apply to private companies. We are choosing to “opt in” to such extended transition period election under Section 107(b). Therefore, we are electing to delay adoption of certain new or revised accounting standards, and as a result, we may choose to not comply with new or revised accounting standards on the relevant dates on which adoption of such standards is required for non-emerging growth companies. As a result of such election, our financial statements may not be comparable to the financial statements of other public companies. See Note 5 to our Consolidated Financial Statements for more information regarding new or revised accounting standards.
We could be an EGC for up to five years, which such fifth anniversary will occur in 2022. However, if certain events occur prior to the end of such five-year period, including if we become a “large accelerated filer,” our annual gross revenues exceed $1.07 billion, or we issue more than $1.0 billion of non-convertible debt in any three-year period, we would cease to be an EGC prior to the
31
end of such five-year period.
We have taken advantage of certain of the reduced disclosure obligations regarding executive compensation in this Annual Report
on Form 10-K and may elect to take advantage of other reduced burdens in future filings. As a result, the information that we provide
to holders of our common stock may be different than the information you might receive from other public reporting companies in
which you hold equity interests. We cannot predict if investors will find our common stock less attractive as a result of our reliance
on these exemptions. If some investors find our common stock less attractive as a result of any choice we make to reduce disclosure,
there may be a less active trading market for our common stock and the price for our common stock may be more volatile.
32
| Item 1B. | Unresolved Staff Comments |
None
| Item 2. | Properties |
Our headquarters is located at 1101 First Avenue North, Fargo, North Dakota, which is also the headquarters of Nodak Insurance. Nodak Insurance owns this building and leases a portion of the building to the North Dakota Farm Bureau and to AFBIS.
Battle Creek owns the building in which its offices are located at 603 South Preece Street, Battle Creek, Nebraska.
Primero owns the building at 2640 South Jones Blvd, Suite 2, Las Vegas, Nevada, and Tri-State Ltd. leases the building at 506 5th Street, Spearfish, South Dakota. Primero employees at these two locations administer their non-standard auto business.
Direct Auto leases office space at 515 North State Street, Chicago, Illinois. Direct Auto employees at this location administer their non-standard auto business. This lease will expire on March 31, 2020, and the Company is evaluating its options to renew or relocate.
We believe that the offices currently occupied by each of our subsidiaries are sufficient for their needs and any expected growth in the near future.
| Item 3. | Legal Proceedings |
We are party to litigation in the normal course of business. Based upon information presently available to us, we do not consider any litigation to be material. However, given the uncertainties attendant to litigation, we cannot assure you that our results of operations and financial condition will not be materially adversely affected by any litigation.
| Item 4. | Mine Safety Disclosures |
Not applicable.
33
| Item 5. | Market for Registrant’s Common Equity, Related Shareholder Matters, and Issuer Purchases of Equity Securities |
Market Information
The Company’s common shares trade on the NASDAQ Capital Market under the symbol “NODK”. As of February 28, 2019, there were approximately 661 shareholders of record for the Company’s common stock.
Stock Performance Graph
The following graph sets forth the cumulative total shareholder return (stock price increase plus dividends) on our common stock from March 16, 2017 (the date of the initial public offering of our common stock) through December 31, 2018, along with the corresponding returns for the Russell 2000 Index (as the broad stock market index) and the SNL US Insurance P&C Index (as the published industry index). The graph assumes that the value of the investment in the common stock and each index was $100 on March 16, 2017 and that all dividends were reinvested.
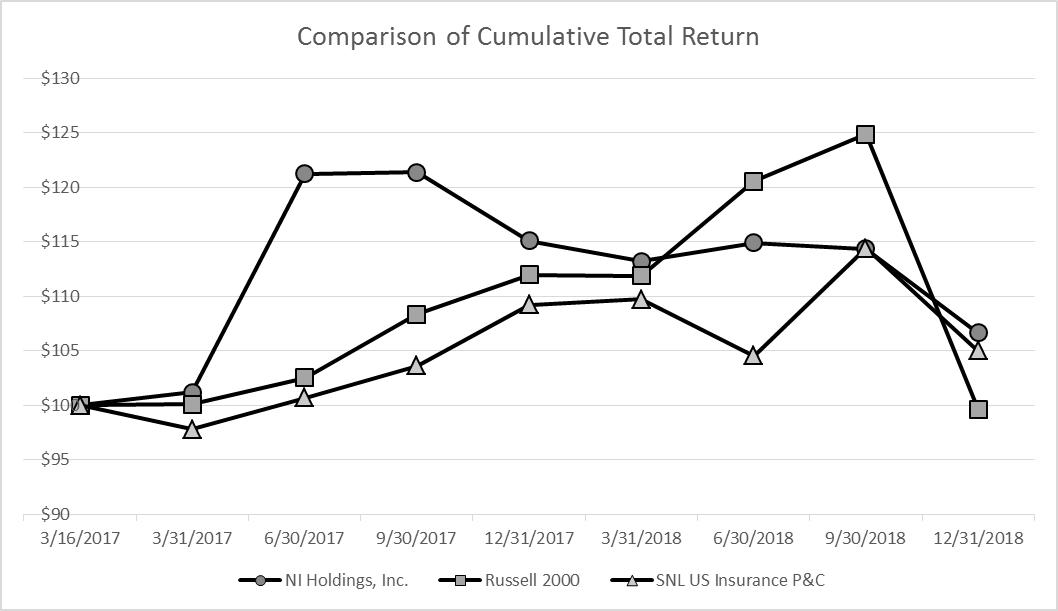
Dividend Policy
Our Board of Directors continues to evaluate a potential policy of paying regular cash dividends, but has not decided on the amounts that may be paid or when the payments may occur. Therefore, the timing and the amount of cash dividends that may be paid to shareholders in the future is uncertain. In addition, the Board of Directors may declare and pay periodic special cash dividends in addition to, or in lieu of, regular cash dividends. In determining whether to declare or pay any dividends, whether regular or special, the Board of Directors will take into account our financial condition and results of operations, income tax considerations, capital requirements, industry standards, and economic conditions. The regulatory restrictions that affect the payment of dividends by Nodak Insurance and Direct Auto to us as discussed below will also be considered. We cannot guarantee that we will pay dividends or that, if paid, we will not reduce or eliminate dividends in the future.
If we pay dividends to our shareholders, we also will be required to pay dividends to Nodak Mutual Group, unless Nodak Mutual Group elects to waive the receipt of dividends. Because Nodak Mutual Group has no current plans to utilize any cash dividends that it may receive from us, we anticipate that it will waive its right to receive substantially all of the dividends that are paid to it by us or immediately return substantially all of such funds to us as an equity contribution. Because the Board of Directors of
34
Nodak Mutual Group includes persons who are not members of our Board of Directors, we cannot provide any assurance, however, that they will take such action with respect to every cash dividend that we may declare. If we are unable to obtain a commitment from the Board of Directors of Nodak Mutual Group that it will waive its right to receive any cash dividend that we intend to declare or that it will return the funds from such dividend to the Company as an equity contribution, our Board of Directors may decide not to declare a cash dividend.
We will not be subject to regulatory restrictions on the payment of dividends. Our ability to pay dividends, however, may depend, in part, upon our receipt of dividends from Nodak Insurance and Direct Auto because we initially will have no source of income other than earnings from the investment of the net proceeds from our initial public offering that we retain. North Dakota law limits the amount of dividends and other distributions that Nodak Insurance may pay to us. Illinois law limits the amount of dividends and other distributions that Direct Auto may pay to us.
North Dakota law sets the maximum amount of dividends that may be paid by Nodak Insurance during any twelve-month period after notice to, but without prior approval of, the North Dakota Insurance Department. This amount cannot exceed the lesser of (i) 10% of the insurance company’s surplus as regards policyholders as of the preceding December 31, or (ii) the insurance company’s statutory net income for the preceding calendar year (excluding realized capital gains), less any prior dividends paid during such twelve-month period. In addition, any insurance company other than a life insurance company may carry forward net income from the preceding two calendar years, not including realized capital gains, less any dividends actually paid during those two calendar years. As of December 31, 2018, the amount available for payment of dividends by Nodak Insurance to us in 2019 without the prior approval of the North Dakota Insurance Department is $17,588. We cannot assure you that the North Dakota Insurance Department would approve the declaration or payment by Nodak Insurance of any dividends to us in excess of such amount.
Illinois law sets the maximum amount of dividends that may be paid by Direct Auto during any twelve-month period after notice to, but without prior approval of, the Illinois Department of Insurance. This amount cannot exceed the greater of (i) 10% of the Company’s surplus as regards policyholders as of the preceding December 31, or (ii) the Company’s statutory net income for the preceding calendar year (excluding realized capital gains). As of December 31, 2018, the amount available for payment of dividends from Direct Auto to us in 2019 without the prior approval of the Illinois Department of Insurance is $6,653. Prior to its payment of any dividend, Direct Auto will be required to provide notice of the dividend to the Illinois Department of Insurance. We cannot assure you that the Illinois Department of Insurance would approve the declaration or payment by Direct Auto of any dividends to us in excess of such amount.
See “Item 1. Business — Regulation”.
Even if we receive any dividends from Nodak Insurance or Direct Auto, we may not declare any dividends to our shareholders because of our working capital requirements. We are not subject to regulatory restrictions on the payment of dividends to shareholders, but we are subject to the requirements of the North Dakota Business Corporation Act. This law generally permits dividends or distributions to be paid as long as, after making the dividend or distribution, we will be able to pay our debts in the ordinary course of business and our total assets will exceed our total liabilities plus the amount that would be needed to satisfy the preferential rights upon dissolution of holders of stock with senior liquidation rights if we were to be dissolved at the time the dividend or distribution is paid.
Unregistered Securities
The Company has not sold any unregistered securities within the past three years.
Use of Proceeds from Initial Public Offering
On January 17, 2017, the SEC declared effective our registration statement on Form S-1 registering our common stock. On March 13, 2017, the Company completed the initial public offering of 10,350,000 shares of common stock at a price of $10.00 per share. The Company received net proceeds of $93,145 from the offering, after deducting the underwriting discounts and offering expenses. Griffin Financial Group, LLC acted as our placement agent in connection with the initial public offering.
Direct Auto was acquired on August 31, 2018 with $17,000 of the net proceeds from the initial public offering. There has been no material change in the planned use of proceeds from our initial public offering as described in our final prospectus filed with the SEC on January 17, 2017.
35
Issuer Stock Purchases
The Company had no common shares outstanding prior to March 13, 2017.
During 2017, our Board of Directors approved an authorization for the repurchase of up to $8,000 of the Company’s outstanding common stock. We purchased 446,671 shares of our common stock for $8,037 during the three months ended June 30, 2017.
During 2018, our Board of Directors approved an authorization for the repurchase of up to approximately $10,000 of the Company’s outstanding common stock. We purchased 191,265 shares of our common stock for $2,996 during the three months ended December 31, 2018.
| Period | Total Number of Shares Purchased | Average Price Paid Per Share | Total Number of Shares Purchased as Part of Publicly Announced Plans or Programs (1) |
Maximum Dollar Value (in thousands) | ||||||||||||
| October 1 - 31, 2018 | — | $ | — | — | $ | 10,000 | ||||||||||
| November 1 – 30, 2018 | 162,012 | 15.6105 | 162,012 | 7,471 | ||||||||||||
| December 1 – 31, 2018 | 29,253 | 15.9602 | 29,253 | 7,004 | ||||||||||||
| Total Shares of Common Stock | 191,265 | $ | 15.6640 | 191,265 | $ | 7,004 | ||||||||||
| (1) Shares purchased pursuant to the March 5, 2018 publicly announced share repurchase authorization of up to approximately $10.0 million of the Company’s outstanding common stock. | ||||||||||||||||
| Item 6. | Selected Financial Data |
You should read the selected financial data set forth below in conjunction with our historical Consolidated Financial Statements and related notes and with “Item 7. Management’s Discussion and Analysis of Financial Condition and Results of Operations” included elsewhere in this Annual Report on Form 10-K.
NI Holdings evaluates its operations by monitoring certain key measures of growth and profitability. In addition to GAAP measures, NI Holdings utilizes certain non-GAAP financial measures that it believes are valuable in managing its business and for providing comparisons to its peers.
These historical results are not necessarily indicative of future results, and the results for any interim period are not necessarily indicative of the results that may be expected for a full year.
36
NI Holdings, Inc.
Four-Year Summary of Selected Financial Data
| Year Ended December 31, | ||||||||||||||||
2018 (1) | 2017 | 2016 | 2015 | |||||||||||||
| Sales: | ||||||||||||||||
| Direct premiums written | $ | 225,223 | $ | 195,238 | $ | 180,870 | $ | 172,775 | ||||||||
| Net premiums written | 201,270 | 185,282 | 156,713 | 143,065 | ||||||||||||
| Revenues: | ||||||||||||||||
| Net premiums earned | $ | 195,720 | $ | 179,464 | $ | 152,756 | $ | 139,473 | ||||||||
| Fee and other income | 6,496 | 1,648 | 1,666 | 1,854 | ||||||||||||
| Net investment income | 6,180 | 5,031 | 3,644 | 3,571 | ||||||||||||
| Net realized capital gain on investments | 3,974 | 2,997 | 5,681 | 823 | ||||||||||||
| Total revenue | 212,370 | 189,140 | 163,747 | 145,721 | ||||||||||||
| Components of net income: | ||||||||||||||||
| Net premiums earned | $ | 195,720 | $ | 179,464 | $ | 152,756 | $ | 139,473 | ||||||||
| Losses and loss adjustment expenses | 119,088 | 122,711 | 118,508 | 83,876 | ||||||||||||
| Amortization of deferred policy acquisition costs and other underwriting and general expenses | 54,710 | 44,423 | 39,122 | 35,972 | ||||||||||||
| Underwriting gain (loss) | 21,922 | 12,330 | (4,874 | ) | 19,625 | |||||||||||
| Fee and other income | 6,496 | 1,648 | 1,666 | 1,854 | ||||||||||||
| Net investment income | 6,180 | 5,031 | 3,644 | 3,571 | ||||||||||||
| Net realized capital gain on investments | 3,974 | 2,997 | 5,681 | 823 | ||||||||||||
| Income before income taxes | 38,572 | 22,006 | 6,117 | 25,873 | ||||||||||||
| Income taxes | 7,328 | 6,394 | 1,479 | 8,288 | ||||||||||||
| Net income | $ | 31,244 | $ | 15,612 | $ | 4,638 | $ | 17,585 | ||||||||
| Earnings per share: | ||||||||||||||||
| Basic | $ | 1.39 | $ | 0.71 | $ | n/a | $ | n/a | ||||||||
| Diluted | $ | 1.39 | $ | 0.71 | $ | n/a | $ | n/a | ||||||||
| Share data: | ||||||||||||||||
| Weighted average shares outstanding used in basic per share calculations | 22,358,858 | 22,512,401 | n/a | n/a | ||||||||||||
| Plus: Dilutive securities | 26,896 | 228 | n/a | n/a | ||||||||||||
| Weighted average shares used in diluted per share calculations | 22,385,754 | 22,512,629 | n/a | n/a | ||||||||||||
| December 31, | ||||||||||||||||
| 2018 (1) | 2017 | 2016 | 2015 | |||||||||||||
| Assets: | ||||||||||||||||
| Cash and investments | $ | 374,371 | $ | 313,885 | $ | 207,677 | $ | 197,793 | ||||||||
| Premiums and agents’ balances receivable | 34,287 | 25,632 | 21,986 | 20,039 | ||||||||||||
| Deferred policy acquisition costs | 12,866 | 8,859 | 8,942 | 8,444 | ||||||||||||
| Other assets | 36,968 | 28,612 | 40,098 | 32,348 | ||||||||||||
| Total assets | $ | 458,492 | $ | 376,988 | $ | 278,703 | $ | 258,624 | ||||||||
| Liabilities: | ||||||||||||||||
| Unpaid losses and loss adjustment expenses | $ | 87,121 | $ | 45,890 | $ | 59,632 | $ | 45,342 | ||||||||
| Unearned premiums | 84,767 | 63,262 | 57,445 | 53,487 | ||||||||||||
| Other liabilities | 10,851 | 12,263 | 8,208 | 9,877 | ||||||||||||
| Total liabilities | 182,739 | 121,415 | 125,285 | 108,706 | ||||||||||||
| Equity | 275,753 | 255,573 | 153,418 | 149,918 | ||||||||||||
| Total liabilities and equity | $ | 458,492 | $ | 376,988 | $ | 278,703 | $ | 258,624 | ||||||||
| Per share data: | ||||||||||||||||
| Total book value per basic share | $ | 12.43 | $ | 11.44 | $ | n/a | $ | n/a | ||||||||
(1) Effective August 31, 2018, the Company acquired
Direct Auto Insurance Company. See Note 4 to the Company’s Consolidated Financial Statements, included elsewhere in this
Report.
37
| Item 7. | Management’s Discussion and Analysis of Financial Condition and Results of Operations |
The following discussion is intended to provide a more comprehensive review of the Company’s operating results and financial condition than can be obtained from reading the Consolidated Financial Statements alone. The discussion should be read in conjunction with the Consolidated Financial Statements and the notes thereto included in “Item 8. Financial Statements and Supplementary Data.” Some of the information contained in this discussion and analysis or set forth elsewhere in this Annual Report on Form 10-K constitutes forward-looking information that involves risks and uncertainties. Please see “Forward-Looking Information” and “Item 1A. Risk Factors” for more information. You should review “Risk Factors” for a discussion of important factors that could cause actual results to differ materially from the results described, or implied by, the forward-looking statements contained herein.
All dollar amounts, except per share amounts, are in thousands.
Overview
NI Holdings is a North Dakota business corporation that is the stock holding company of Nodak Insurance Company and became such in connection with the conversion of Nodak Mutual Insurance Company from a mutual to stock form of organization and the creation of a mutual holding company. The conversion was consummated on March 13, 2017. Immediately following the conversion, all of the outstanding shares of common stock of Nodak Insurance Company were issued to Nodak Mutual Group, which then contributed the shares to NI Holdings in exchange for 55% of the outstanding shares of common stock of NI Holdings. Nodak Insurance Company then became a wholly-owned stock subsidiary of NI Holdings. Prior to completion of the conversion, NI Holdings conducted no business and had no assets or liabilities. As a result of the conversion, NI Holdings became the holding company for Nodak Insurance Company and its existing subsidiaries.
These consolidated financial statements of NI Holdings include the financial position and results of operations of NI Holdings and six other entities:
| · | Nodak Insurance – a wholly-owned subsidiary of NI Holdings; |
| · | Nodak Agency, Inc. – a wholly-owned subsidiary of Nodak Insurance; |
| · | American West – a wholly-owned subsidiary of Nodak Insurance; |
| · | Primero – an indirect wholly-owned subsidiary of Nodak Insurance; |
| · | Battle Creek – an affiliated company of Nodak Insurance; and |
| · | Direct Auto – a wholly-owned subsidiary of NI Holdings. |
Battle Creek is managed by Nodak Insurance, and Nodak Insurance reinsures 100% of the risk on all insurance policies issued by Battle Creek. Nodak Agency is an inactive shell corporation.
On August 31, 2018, NI Holdings completed the acquisition of 100% of the common stock of Direct Auto from private shareholders and Direct Auto became a consolidated subsidiary of the Company. Direct Auto is a property and casualty insurance company specializing in non-standard automobile insurance in the state of Illinois. Direct Auto remains headquartered in Chicago, Illinois and the current president of Direct Auto will continue to manage the Direct Auto insurance operations along with the current staff and management team. The results of Direct Auto are included as part of the Company’s non-standard auto business segment following the closing date.
Nodak Insurance offers property and casualty insurance, crop hail, and multi-peril crop insurance to members of the North Dakota Farm Bureau through captive agents in North Dakota. American West and Battle Creek offer similar insurance coverage through independent agents in South Dakota and Minnesota, and Nebraska, respectively. Primero offers limited nonstandard auto insurance coverage in Arizona, Nevada, North Dakota, and South Dakota. Direct Auto offers limited nonstandard auto insurance coverage in Illinois. Nodak Insurance and Battle Creek are rated by “A” by A.M. Best, which is the third highest out of a possible 15 ratings. American West is rated “A-”. Primero and Direct Auto are unrated.
Marketplace Conditions and Trends
The property and casualty insurance industry is affected by recurring industry cycles known as “hard” and “soft” markets. A soft cycle is characterized by intense competition resulting in lower pricing in order to compete for business. A hard market, generally considered a beneficial industry trend, is characterized by reduced competition that results in higher pricing. We believe that the market is generally in a stable phase as different portions of the market respond to higher frequency and severity of weather-related events.
38
Unlike property and casualty insurance, the total crop insurance premiums written each year vary mainly based on prevailing commodity prices for the type of crops planted, because the aggregate number of acres planted does not vary much from year to year. Because the premiums that are charged for crop insurance are established by the RMA, which is a division of the United States Department of Agriculture, and the policy forms and terms are also established by the RMA, insurers do not compete on price or policy terms and conditions. Moreover, because participation in other federal farm programs by a farmer is conditioned upon participation in the federal crop insurance program, most commercial farmers obtain crop insurance on their plantings each year.
Principal Revenue Items
The Company derives its revenue primarily from net premiums earned, net investment income, and net realized capital gain (loss) on investments.
Gross and net premiums written
Gross premiums written is equal to direct premiums written and assumed premiums before the effect of ceded reinsurance. Gross premiums written are recognized upon sale of new insurance contracts or renewal of existing contracts. Net premiums written is equal to gross premiums written less premiums ceded or paid to reinsurers (ceded premiums written).
Premiums earned
Premiums earned is the earned portion of net premiums written. Gross premiums written include all premiums recorded by an insurance company during a specified policy period. Insurance premiums on property and casualty policies are recognized in proportion to the underlying risk insured and are earned ratably over the duration of the policies or, in the case of crop insurance, over the period of risk to the Company. At the end of each accounting period, the portion of the premiums that is not yet earned is included in unearned premiums and is realized as revenue in subsequent periods over the remaining term of the policy or period of risk. NI Holdings’ property and casualty policies typically have a term of twelve months. For example, for an annual policy that is written on July 1, 2018, one-half of the premiums would be earned in 2018 and the other half would be earned in 2019.
Due to the nature of the crop planting and harvesting cycle and the deadlines for filing and processing claims under the federal crop insurance program, insurance premiums for crop insurance are generally recognized and earned during the period of risk, which usually begins in spring and ends with harvest in the fall. Under the federal crop insurance program, farmers must purchase crop insurance with respect to spring planted crops by March 15. By July 15, the farmer must report the number of acres he has planted in each crop. On September 1, the insurer bills the farmer for the insurance premium, which is due and payable by the farmer by October 1. If the farmer does not pay the premium by such date, the insurer must essentially provide a loan to the farmer in an amount equal to the premium at an annual interest rate of 15% because the insurer is required to pay the farmer’s portion of the premium to the Federal Crop Insurance Corporation (“FCIC”) by November 15, regardless of whether the farmer pays the premium to the insurer. Except for claims occurring in the spring (primarily for prevented planting and required replanting claims), claims are required to be filed with the FCIC by December 15. A different cycle exists for crops planted in the fall, such as winter wheat, but the vast majority of crop insurance written by NI Holdings covers crops planted in the spring.
Net investment income and net realized capital gain (loss) on investments
NI Holdings invests its surplus and the funds supporting its insurance liabilities (including unearned premiums, and unpaid loss and loss adjustment expenses) in cash, cash equivalents, equity securities, and fixed income securities. Investment income includes interest and dividends earned on invested assets, and is reported net of investment-related expenses. Net realized capital gains and losses on investments are reported separately from net investment income. NI Holdings recognizes realized capital gains when investments are sold for an amount greater than their cost or amortized cost (in the case of fixed income securities) and recognizes realized capital losses when investments are written down as a result of an other-than-temporary impairment or sold for an amount less than their cost or amortized cost, as applicable. NI Holdings’ portfolio of investments is managed by Conning, Inc., Disciplined Growth Investors, and CIBC Personal Wealth Management. These investment managers have discretion to buy and sell securities in accordance with the investment policy approved by our Board of Directors.
Principal Expense Items
NI Holdings’ expenses consist primarily of losses and loss adjustment expenses (“LAE”), amortization of deferred policy acquisition costs, other underwriting and general expenses, and income taxes.
39
Losses and Loss Adjustment Expenses
Losses and LAE represent the largest expense item and include (1) claim payments made, (2) estimates for future claim payments and changes in those estimates from prior periods, and (3) costs associated with investigating, defending, and adjusting claims, including legal fees.
Amortization of deferred policy acquisition costs and other underwriting and general expenses
Expenses incurred to underwrite risks are referred to as policy acquisition costs. Policy acquisition costs consist of commission expenses, premium taxes, and certain other underwriting expenses that vary with and are primarily related to the writing and acquisition of new and renewal business. These policy acquisition costs are deferred and amortized over the effective period of the related insurance policies. Other underwriting and general expenses consist of salaries, professional fees, office supplies, depreciation, and all other operating expenses not otherwise classified separately, as well as payments to bureaus and assessments of statistical agencies for policy service and administration items such as rating manuals, rating plans, and experience data.
Income taxes
NI Holdings uses the asset and liability method of accounting for deferred income taxes. Deferred income taxes arise from the recognition of temporary differences between financial statement carrying amounts and the tax bases of its assets and liabilities. A valuation allowance is provided when it is more likely than not that some portion of the deferred income tax asset will not be realized. The effect of a change in tax rates is recognized in the period of the enactment date.
Non-GAAP Financial Measures
NI Holdings evaluates its insurance operations in the way it believes will be most meaningful and representative of its business results. Some of these measurements are “non-GAAP financial measures” under Securities and Exchange Commission rules and regulations. GAAP is the acronym for “accounting principles generally accepted in the United States of America”. The non-GAAP financial measures that NI Holdings presents may not be compatible to similarly-named measures reported by other companies. The non-GAAP financial measures described in this section are used widely in the property and casualty insurance industry, and are the expense ratio, loss and LAE ratio, combined ratio, written premiums, ratio of net written premiums to statutory surplus, underwriting gain, return on average equity, and risk based capital.
NI Holdings measures growth by monitoring changes in gross premiums written and net premiums written. The Company measures underwriting profitability by examining its loss and LAE ratio, expense ratio, and combined ratio. It also measures profitability by examining underwriting gain (loss), net income (loss), and return on average equity.
Loss and LAE ratio
The loss and LAE ratio is the ratio (expressed as a percentage) of losses and LAE incurred to premiums earned. NI Holdings measures the loss and LAE ratio on an accident year and calendar year loss basis to measure underwriting profitability. An accident year loss ratio measures losses and LAE for insured events occurring in a particular year, regardless of when they are reported, as a percentage of premiums earned during that year. A calendar year loss ratio measures losses and LAE for insured events occurring during a particular year and the change in loss reserves from prior policy years as a percentage of premiums earned during that year.
Expense ratio
The expense ratio is the ratio (expressed as a percentage) of amortization of deferred policy acquisition costs and other underwriting and general expenses (attributable to insurance operations) to premiums earned, and measures our operational efficiency in producing, underwriting, and administering the Company’s insurance business.
Combined ratio
The Company’s combined ratio is the ratio (expressed as a percentage) of the sum of losses and LAE incurred and expenses to premiums earned, and measures its overall underwriting profit. Generally, if the combined ratio is below 100%, NI Holdings is making an underwriting profit. If the combined ratio is above 100%, it is not profitable without investment income and may not be profitable if investment income is insufficient.
Premiums written
Premiums written represent a measure of business volume most relevant on an annual basis for the Company’s business model. This measure includes the amount of premium purchased by policyholders as of the policy’s effective date, whereas premiums earned
40
as presented in the statement of operations matches the amount of premium to the period of risk for those insurance policies. The Company’s insurance policies are sold with a variety of effective periods, including annual, semi-annual, and monthly.
Net premiums written to statutory surplus ratio
The net premiums written to statutory surplus ratio represents the ratio of net premiums written to statutory surplus. This ratio is designed to measure the ability of the Company to absorb above-average losses and the Company’s financial strength. In general, a low premium to surplus ratio is considered a sign of financial strength because the Company is theoretically using its capacity to write more policies. Statutory surplus is determined using accounting principles prescribed or permitted by the insurance subsidiaries’ state of domicile and differs from GAAP equity.
Underwriting gain (loss)
Underwriting gain (loss) measures the pre-tax profitability of insurance operations. It is derived by subtracting losses and LAE, amortization of deferred policy acquisition costs, and other underwriting and general expenses from net premiums earned. Each of these items is presented as a caption in NI Holdings’ Consolidated Statements of Operations.
Net income (loss) and return on average equity
NI Holdings uses net income (loss) to measure its profit and uses return on average equity to measure its effectiveness in utilizing equity to generate net income. In determining return on average equity for a given year, net income (loss) is divided by the average of the beginning and ending equity for that year.
Critical Accounting Policies
General
The preparation of financial statements in accordance with GAAP requires both the use of estimates and judgment relative to the application of appropriate accounting policies. NI Holdings is required to make estimates and assumptions in certain circumstances that affect amounts reported in its consolidated financial statements and related footnotes. NI Holdings evaluates these estimates and assumptions on an ongoing basis based on historical developments, market conditions, industry trends, and other information that it believes to be reasonable under the circumstances. There can be no assurance that actual results will conform to these estimates and assumptions and that reported results of operations would not be materially adversely affected by the need to make accounting adjustments to reflect changes in these estimates and assumptions from time to time. NI Holdings believes the following policies are the most sensitive to estimates and judgments.
Unpaid Losses and Loss Adjustment Expenses
How reserves are established
With respect to its traditional property and casualty insurance products, the Company maintains reserves for the payment of claims (indemnity losses) and expenses related to adjusting those claims (LAE). The Company’s liability for unpaid losses and LAE consists of (1) case reserves, which are reserves for claims that have been reported to it, and (2) reserves for claims that have been incurred but have not yet been reported and for the future development of case reserves (“IBNR”).
When a claim is reported to NI Holdings, its claims personnel establish a case reserve for the estimated amount of the ultimate payment to the extent it can be determined or estimated. The amount of the loss reserve for the reported claim is based primarily upon an evaluation of coverage, liability, damages suffered, and any other information considered pertinent to estimating the exposure presented by the claim. Each claim is contested or settled individually based upon its merits, and some property and casualty claims may take years to resolve, especially if legal action is involved. Case reserves are reviewed on a regular basis and are updated as new information becomes available.
When a catastrophe occurs, which in the Company’s case mostly involves the weather perils of wind and hail, NI Holdings utilizes mapping technology through geographic coding of its property risks to overlay the path of the storm. This enables the Company to establish estimated damage amounts based on the wind speed and size of the hail for case or per claim loss amounts. This process allows the Company to determine within a reasonable time (5 – 7 days) an estimated number of claims and estimated losses from the storm. If the Company estimates the damages to be in excess of its retained catastrophe amount, reinsurers are notified immediately of a potential loss so that the Company can quickly recover reinsurance payments once the retention is exceeded.
41
In addition to case reserves, NI Holdings maintains estimates of reserves for losses and LAE incurred but not reported. These reserves include estimates for the future development of case reserves. Some claims may not be reported for several years. As a result, the liability for unpaid losses and LAE may include significant estimates for IBNR.
The Company estimates multi-peril crop insurance losses on a quarterly basis based upon historical loss patterns, current crop conditions, current weather patterns, and input from crop loss adjusters. These estimates have proven to be reasonably accurate indicators of the Company’s anticipated losses for this line of business.
NI Holdings utilizes an independent actuary to assist with the estimation of its liability for unpaid losses and LAE. This actuary prepares estimates by first deriving an actuarially based estimate of the ultimate cost of total losses and LAE incurred as of the financial statement date based on established actuarial methods as described below. The Company then reduces the estimated ultimate loss and LAE by loss and LAE payments and case reserves carried as of the financial statement date. The actuarially determined estimate is based upon indications from one of the following actuarial methodologies or uses a weighted average of these results. The specific method used to estimate the ultimate losses would vary depending on the judgment of the actuary as to what is the most appropriate method for the property and casualty business. The Company’s management reviews these estimates and supplements the actuarial analysis with information not fully incorporated into the actuarially based estimate, such as changes in the external business environment and internal company processes. NI Holdings may adjust the actuarial estimates based on this supplemental information in order to arrive at the amount recorded in the Consolidated Financial Statements.
NI Holdings determines its ultimate liability for unpaid losses and LAE by using the following actuarial methodologies:
Bornhuetter-Ferguson Method — The Bornhuetter-Ferguson Method is a blended method that explicitly takes into account both actual loss development to date and expected future loss emergence. This method is applied on both a paid loss basis and an incurred loss basis. This method uses selected loss development patterns to calculate the expected percentage of losses unpaid (or unreported). The expected future loss component of the method is calculated by multiplying earned premium for the given exposure period by a selected a priori (i.e. deductive) loss ratio. The resulting dollars are then multiplied by the expected percentage of unpaid (or unreported) losses described above. This provides an estimate of future paid (or reported) losses that is then added to actual paid (or incurred) loss data to produce the estimated ultimate loss.
Paid and Case Incurred Loss Development Method — The Paid and Case Incurred Loss Development Method utilizes ratios of cumulative paid or case incurred losses or LAE at each age of development as a percent of the preceding development age. Selected ratios are then multiplied together to produce a set of loss development factors which when applied to the most current data value, by accident year, develop the estimated ultimate losses or LAE. Ultimate losses or LAE are then selected for each accident year from the various methods employed.
Ratio of Paid ALAE to Paid Loss Method — This method utilizes the ratio of paid allocated loss adjustment expense (“ALAE”) to paid losses and is similar to the Paid and Case Incurred Method described above, except that the data projected are the ratios of paid ALAE to paid losses. The projected ultimate ratio is then multiplied by the selected ultimate losses, by accident year, to yield the ultimate ALAE. ALAE reserves are calculated by subtracting paid losses from ultimate ALAE.
The process of estimating loss reserves involves a high degree of judgment and is subject to a number of variables. These variables can be affected by both internal and external events, such as changes in claims handling procedures, inflation, legal trends, and legislative changes, among others. The impact of many of these items on ultimate costs for losses and loss adjustment expenses is difficult to estimate. Loss reserve estimation is affected by the volume of claims, the potential severity of individual claims, the determination of occurrence date for a claim, and reporting lags (the time between the occurrence of the policyholder event and when it is actually reported to the insurer). Informed judgment is applied throughout the process, including the application of various individual experiences and expertise to multiple sets of data and analyses. NI Holdings continually refines its estimates of unpaid losses and LAE in a regular ongoing process as historical loss experience develops and additional claims are reported and settled. NI Holdings considers all significant facts and circumstances known at the time the liabilities for unpaid losses and LAE are established.
There is an inherent amount of uncertainty in the establishment of liabilities for unpaid losses and LAE. This uncertainty is greatest in the current and most recent accident years due to the relative newness of the claims being reported and the relatively small percentage of these claims that have been reported, investigated, and adjusted by the Company’s claims staff. Therefore, the reserves carried in these more recent accident years are generally more conservative than those carried for older accident years. As the Company has the opportunity to investigate and adjust the reported claims, both the case and IBNR reserves are adjusted to more closely reflect the ultimate expected loss.
Other factors that have or can have an impact on the Company’s case and IBNR reserves include but are not limited to those described below.
42
Changes in liability law and public attitudes regarding damage awards
Laws governing liability claims and judicial interpretations thereof can change over time, which can expand the scope of coverage anticipated by insurers when initially establishing reserves for claims. In addition, public attitudes regarding damage awards can result in judges and juries granting higher recoveries for damages than expected by claims personnel when claims are presented. In addition, these changes can result in both increased claim frequency and severity as both plaintiffs and their legal counsel perceive the opportunity for higher damage awards. Reserves established for claims that occurred in prior years would not have anticipated these legal changes and, therefore, could prove to be inadequate for the ultimate losses paid by the Company, causing the Company to experience adverse development and higher loss payments in future years.
Change in claims handling and/or setting case reserves
Changes in Company personnel and/or the approach to how claims are reported, adjusted, and reserved may affect the reserves established by the Company. As discussed above, the setting of IBNR reserves is not an exact science and involves the expert judgment of an actuary. One actuary’s reserve opinion may differ slightly from another actuary’s opinion. This is the primary reason why the IBNR reserve estimate is customarily reported as a range by a company’s actuary, which provides a company with an acceptable “range” to use in establishing its best estimate for IBNR reserves.
Economic inflation
A sudden and extreme increase in the economic inflation rate could have a significant impact on the Company’s case and IBNR reserves. When establishing case reserves, claims personnel generally establish an amount that in their opinion will provide a conservative amount to settle the loss. If the time to settle the claim extends over a period of years, the initial reserve may not anticipate an economic inflation rate that is significantly higher than the current inflation rate. This can also apply to IBNR reserves. Should the economic inflation rate increase significantly, it is likely that the Company may not anticipate the need to adjust the IBNR reserves accordingly, which could lead to the Company being deficient in its IBNR reserves.
Increases or decreases in claim severity for reasons other than inflation
Factors exist that can drive the cost to settle claims for reasons other than standard inflation. For example, demand surge caused by a very large catastrophe (as in the case of Hurricane Katrina) has an impact on not only the availability and cost of building materials such as roofing and other materials, but also on the availability and cost of labor. Other factors such as increased vehicle traffic in an area not designed to handle the increased congestion and increased speed limits on busy roads are examples of changes that could cause claim severity to increase beyond what the Company’s historic reserves would reflect. In addition, unexpected increases in the labor costs and healthcare costs that underlie insured risks, changes in costs of building materials, or changes in commodity prices for insured crops may cause fluctuations in the ultimate development of the case reserves.
Actual settlement experience different from historical data trends
When establishing IBNR reserves, the Company’s actuary takes into account many of the factors discussed above. One of the more important factors that is considered when setting reserves is the past or historical claim settlement experience. Our actuary considers factors such as the number of files entering litigation, payment patterns, length of time it takes Company claims personnel to settle the claims, and average payment amounts when estimating reserve amounts. Should future settlement patterns change due to the legal environment, Company claims handling philosophy, or personnel, it may have an impact on the future claims payments, which could cause existing reserves to either be redundant (excessive) or deficient (below) compared to the actual loss amount.
Change in Reporting Lag
As discussed above, NI Holdings and its actuary utilize historical patterns to provide an accurate estimate of what will take place in the future. Should we experience an unexpected delay in reporting time (claims are slower to be reported than in the past), our actuary or we may underestimate the anticipated number of future claims, which could cause the ultimate loss we may experience to be underestimated. A lag in reporting may be caused by changes in how claims are reported (online vs. through company personnel), the type of business or lines of business the Company is writing, the Company’s distribution system (direct writer, independent agent, or captive agent), and the geographic area where the Company chooses to insure risk.
Due to the inherent uncertainty underlying loss reserve estimates, final resolution of the estimated liability for unpaid losses and LAE may be higher or lower than the related loss reserves at the reporting date. Therefore, actual paid losses, as claims are settled in the future, may be materially higher or lower in amount than current loss reserves. The Company reflects adjustments to the liability for unpaid losses and LAE in the results of operations during the period in which the estimates are changed.
43
Actuarial Loss Reserves
NI Holdings’ liabilities for unpaid losses and LAE are summarized below:
| December 31, | ||||||||||||
| 2018 | 2017 | 2016 | ||||||||||
| Case reserves | $ | 74,949 | $ | 29,376 | $ | 42,081 | ||||||
| IBNR reserves | 9,940 | 12,386 | 10,359 | |||||||||
| Net unpaid losses and LAE | 84,889 | 41,762 | 52,440 | |||||||||
| Reinsurance recoverables on losses | 2,232 | 4,128 | 7,192 | |||||||||
| Liability for unpaid losses and LAE | $ | 87,121 | $ | 45,890 | $ | 59,632 | ||||||
The following tables provides case and IBNR reserves for unpaid losses and LAE by segment.
| December 31, 2018 | ||||||||||||
| Case Reserves | IBNR Reserves | Total Reserves | ||||||||||
| Private passenger auto | $ | 13,276 | $ | 4,702 | $ | 17,978 | ||||||
| Non-standard auto | 49,109 | (2,323 | ) | 46,786 | ||||||||
| Home and farm | 7,511 | 2,491 | 10,002 | |||||||||
| Crop | 1,686 | 56 | 1,742 | |||||||||
| All other | 3,367 | 5,014 | 8,381 | |||||||||
| Net unpaid losses and LAE | $ | 74,949 | $ | 9,940 | $ | 84,889 | ||||||
| Reinsurance recoverables on losses | 1,201 | 1,031 | 2,232 | |||||||||
| Liability for unpaid losses and LAE | $ | 76,150 | $ | 10,971 | $ | 87,121 | ||||||
| December 31, 2017 | ||||||||||||
| Case Reserves | IBNR Reserves | Total Reserves | ||||||||||
| Private passenger auto | $ | 13,008 | $ | 4,107 | $ | 17,115 | ||||||
| Non-standard auto | 5,186 | 624 | 5,810 | |||||||||
| Home and farm | 6,667 | 2,394 | 9,061 | |||||||||
| Crop | 997 | 22 | 1,019 | |||||||||
| All other | 3,518 | 5,239 | 8,757 | |||||||||
| Net unpaid losses and LAE | $ | 29,376 | $ | 12,386 | $ | 41,762 | ||||||
| Reinsurance recoverables on losses | 3,171 | 957 | 4,128 | |||||||||
| Liability for unpaid losses and LAE | $ | 32,547 | $ | 13,343 | $ | 45,890 | ||||||
| December 31, 2016 | ||||||||||||
| Case Reserves | IBNR Reserves | Total Reserves | ||||||||||
| Private passenger auto | $ | 19,767 | $ | 3,904 | $ | 23,671 | ||||||
| Non-standard auto | 5,209 | 724 | 5,933 | |||||||||
| Home and farm | 9,533 | 2,105 | 11,638 | |||||||||
| Crop | 3,607 | 84 | 3,691 | |||||||||
| All other | 3,965 | 3,542 | 7,507 | |||||||||
| Net unpaid losses and LAE | $ | 42,081 | $ | 10,359 | $ | 52,440 | ||||||
| Reinsurance recoverables on losses | 6,286 | 906 | 7,192 | |||||||||
| Liability for unpaid losses and LAE | $ | 48,367 | $ | 11,265 | $ | 59,632 | ||||||
Sensitivity of Major Assumptions Underlying the Liabilities for Unpaid Losses and Loss Adjustment Expenses
Management has identified the impact on earnings of various factors used in establishing loss reserves so that users of the Company’s financial statements can better understand how development on prior years’ reserves might affect the Company’s results of operations.
44
Total Reserves
As of December 31, 2018, the impact of a 1% change in our estimate for unpaid losses and LAE, net of reinsurance recoverables, on our net income, after income taxes of 21%, would be approximately $671.
Inflation
Inflation is not explicitly selected in the loss reserve analysis. However, historical inflation is embedded in the estimated loss development factors. The following table displays the impact on net income, after income taxes of 21%, resulting from various changes from the inflation factor implicitly embedded in the estimated payment pattern as of December 31, 2018. A change in inflation may or may not fully affect loss payments in the future because some of the underlying expenses have already been paid. The table below assumes that any change in inflation will be fully reflected in future loss payments. This variance in future IBNR emergence could occur in one year or over multiple years, depending when the change is recognized.
| Change in Inflation | Impact on After-Tax Earnings | |||
| -1% | $ | (1,170 | ) | |
| 1% | 1,200 | |||
| 3% | 3,693 | |||
| 5% | 6,318 | |||
Inflation includes actual inflation as well as social inflation that includes future emergence of new classes of losses or types of losses, change in judicial awards, and any other changes beyond assumed levels that affect the cost of claims.
Case Reserves
When a claim is reported, claims personnel establish a case reserve for the estimated amount of the ultimate payment to the extent it can be determined or estimated. It is possible that the level of adequacy in the case reserve may differ from historical levels and/or the claims reporting pattern may change. The following table displays the impact on net income, after income taxes of 21%, which results from various changes to the level of case reserves as of December 31, 2018. This variance in future IBNR emergence could occur in one year or over multiple years, depending when the change is recognized.
| Change in Case Reserves | Impact on After-Tax Earnings | |||
| -10% | $ | (6,045 | ) | |
| -5% | (3,022 | ) | ||
| -2% | (1,209 | ) | ||
| +2% | 1,209 | |||
| +5% | 3,022 | |||
| +10% | 6,045 | |||
Investments
NI Holdings’ fixed income securities and equity securities are classified as available-for-sale and carried at estimated fair value as determined by management based upon quoted market prices or a recognized pricing service at the reporting date for those or similar investments. Changes in unrealized investment gains or losses on the fixed income securities, and on equity securities through December 31, 2018, net of applicable income taxes, are reflected directly in Equity as a component of comprehensive income (loss) and, accordingly, have no effect on net income (loss). Effective January 1, 2019, changes in unrealized investments gains or losses on equity securities will impact net income (loss) as they occur instead of as an adjustment to Equity as a component of comprehensive income (loss). Investment income is recognized when earned, and realized capital gains and losses on investments are recognized when investments are sold, or an other-than-temporary impairment is recognized.
NI Holdings evaluates securities for other-than-temporary impairment (“OTTI”) at least on a quarterly basis. NI Holdings assesses whether OTTI is present when the fair value of a security is less than its amortized cost. OTTI is considered to have occurred with respect to fixed income securities if (1) an entity intends to sell the security, (2) it is more likely than not an entity will be required to sell the security before recovery of its amortized cost basis, or (3) the present value of the expected cash flows is not sufficient to recover the entire amortized cost basis. When assessing whether the cost or amortized cost basis of the security will be recovered, the Company compares the present value of the expected cash flows likely to be collected, based on an evaluation of all available information relevant to the collectability of the security, to the cost or amortized cost basis of the security. The shortfall of the present value of the cash flows expected to be collected in relation to the cost of amortized cost basis is referred to as the “credit loss”. If there is a credit loss, the impairment is considered to be other-than-temporary. If NI Holdings identifies that an other-than-temporary impairment loss has occurred, it then determines whether it intends to sell the security, or if it is more likely than not that the Company will be required to sell the security prior to recovering the cost or amortized cost basis less any current-period credit
45
losses. If NI Holdings determines that it does not intend to sell, and it is not more likely than not that it will be required to sell the security, the amount of the impairment loss related to the credit loss will be recorded in earnings, and the remaining portion of the other-than-temporary impairment loss will be recognized in other comprehensive income (loss), net of income taxes. If NI Holdings determines that it intends to sell the security, or that it is more likely than not that it will be required to sell the security prior to recovering its cost or amortized cost basis less any current-period credit losses, the full amount of the other-than-temporary impairment will be recognized in earnings.
Fair values of interest rate sensitive instruments may be affected by increases and decreases in prevailing interest rates that generally translate, respectively, into decreases and increases in fair values of fixed income securities. The fair values of interest rate sensitive instruments also may be affected by the credit worthiness of the issuer, prepayment options, relative values of other investments, the liquidity of the instrument, and other general market conditions.
For the year ended December 31, 2018, NI Holdings’ investment portfolio experienced a loss in the net change in unrealized gains/losses of $12,279, with losses occurring in both fixed income and equity securities.
| December 31, 2018 | December 31, 2017 | Change | ||||||||||
| Fixed income securities: | ||||||||||||
| Gross unrealized gains | $ | 1,077 | $ | 2,738 | $ | (1,661 | ) | |||||
| Gross unrealized losses | (3,402 | ) | (958 | ) | (2,444 | ) | ||||||
| Net fixed income securities unrealized gains (losses) | (2,325 | ) | 1,780 | (4,105 | ) | |||||||
| Equity securities: | ||||||||||||
| Gross unrealized gains | 14,180 | 19,186 | (5,006 | ) | ||||||||
| Gross unrealized losses | (3,821 | ) | (653 | ) | (3,168 | ) | ||||||
| Net equity securities unrealized gains | 10,359 | 18,533 | (8,174 | ) | ||||||||
| Net unrealized gains | $ | 8,034 | $ | 20,313 | $ | (12,279 | ) | |||||
NI Holdings has evaluated each security and taken into account the severity and duration of any impairment, the current rating on the bond, and the outlook for the issuer according to independent analysts. The Company’s fixed income portfolio is managed by Conning Asset Management, which specializes in the handling of insurance company investments and participates in this evaluation.
For the year ended December 31, 2018, NI Holdings recognized $382 of other-than-temporary impairments of its investment securities. For the year ended December 31, 2017, NI Holdings recognized $330 of other-than-temporary impairments of its investment securities. For the year ended December 31, 2016, NI Holdings recognized no other-than-temporary impairments of its investment securities. Adverse investment market conditions, or poor operating results of underlying investments, could result in impairment charges in the future.
For more information on the Company’s investments, see Note 6 to the Consolidated Financial Statements, included elsewhere in this Report.
Fair Value Measurements
NI Holdings uses fair value measurements to record fair value adjustments to certain assets to determine fair value disclosures. Investment securities available for sale are recorded at fair value on a recurring basis. Additionally, from time to time, NI Holdings may be required to record at fair value other assets on a nonrecurring basis. These nonrecurring fair value adjustments typically involve application of lower-of-cost-or-market accounting or write-downs of individual assets. Accounting guidance on fair value measurements and disclosures establishes a fair value hierarchy that prioritizes the inputs to valuation methods used to measure fair value. The three levels of the fair value hierarchy are as follows:
| Level I: | Unadjusted quoted prices in active markets that are accessible at the measurement date for identical, unrestricted assets or liabilities. |
| Level II: | Quoted prices in markets that are not active, or inputs that are observable either directly or indirectly, for substantially the full term of the asset or liability. Level II includes fixed income securities with quoted prices that are traded less frequently than exchange traded instruments. Valuation techniques include matrix pricing which is a mathematical technique used widely in the industry to value fixed income securities without relying exclusively on quoted market prices for the specific securities but rather by relying on the securities’ relationship to other benchmark quoted prices. |
46
| Level III: | Prices or valuation techniques that require inputs that are both significant to the fair value measurement and unobservable (i.e., supported with little or no market activity). |
NI Holdings bases its fair values on the price that would be received to sell an asset or paid to transfer a liability in an orderly transaction between market participants at the measurement date. It is our policy to maximize the use of observable inputs and minimize the use of unobservable inputs when developing fair value measurements, in accordance with the fair value hierarchy. Fair value measurements for assets where there exists limited or no observable market data and, therefore, are based primarily upon the estimates of NI Holdings or other third-parties, and are often calculated based on the characteristics of the asset, the economic and competitive environment, and other such factors. Management uses its best judgment in estimating the fair value of the Company’s financial instruments; however, there are inherent weaknesses in any estimation technique. Therefore, for substantially all financial instruments, the fair value estimates herein are not necessarily indicative of the amounts which NI Holdings could have realized in a sale transaction on the dates indicated. The estimated fair value amounts have been measured as of their respective period-end and have not been re-evaluated or updated for purposes of our financial statements subsequent to those respective dates. As such, the estimated fair values of these financial instruments subsequent to the respective reporting dates may be different than the amounts reported at each period-end. Additionally, changes in the underlying assumptions used, including discount rates and estimates of future cash flows, could significantly affect the results of current or future valuations.
NI Holdings uses quoted values and other data provided by an independent pricing service in its process for determining fair values of its investments. The evaluations of such pricing services represent an exit price and a good faith opinion as to what a buyer in the marketplace would pay for a security in a current sale. This pricing service provides NI Holdings with one quote per instrument. For fixed income securities that have quoted prices in active markets, market quotations are provided. For fixed income securities that do not trade on a daily basis, the independent pricing service prepares estimates of fair value using a wide array of observable inputs including relevant market information, benchmark curves, benchmarking of like securities, sector groupings, and matrix pricing. The observable market inputs that the Company’s independent pricing service utilizes may include (listed in order of priority for use) benchmark yields, reported trades, broker-dealer quotes, issuer spreads, two-sided markets, benchmark securities, market bids/offers, and other reference data on markets, industry, and the economy. Additionally, the independent pricing service uses an option-adjusted spread model to develop prepayment and interest rate scenarios. The pricing service did not use broker quotes in determining fair values of the Company’s investments.
Should the independent pricing service be unable to provide a fair value estimate, NI Holdings would attempt to obtain a non-binding fair value estimate from a number of broker-dealers and would review this estimate in conjunction with a fair value estimate reported by an independent business news service or other sources. In instances where only one broker-dealer provides a fair value for a fixed income security, NI Holdings would use that estimate. In instances where NI Holdings would be able to obtain fair value estimates from more than one broker-dealer, the Company would review the range of estimates and select the most appropriate value based on the facts and circumstances. Should neither the independent pricing service nor a broker-dealer provide a fair value estimate, NI Holdings would develop a fair value estimate based on cash flow analyses and other valuation techniques that utilize certain unobservable inputs. Accordingly, NI Holdings classifies such a security as a Level III investment.
The fair value estimates of NI Holdings’ investments provided by the independent pricing service at each period-end were utilized, among other resources, in reaching a conclusion as to the fair value of its investments.
Management reviews the reasonableness of the pricing provided by the independent pricing service by employing various analytical procedures. Management reviews all securities to identify recent downgrades, significant changes in pricing, and pricing anomalies on individual securities relative to other similar securities. This will include looking for relative consistency across securities in common sectors, durations, and credit ratings. This review will also include all fixed income securities rated lower than “A” by Moody’s or Standard & Poor’s. If, after this review, management does not believe the pricing for any security is a reasonable estimate of fair value, then it will seek to resolve the discrepancy through discussions with the pricing service. In its review, management did not identify any such discrepancies, and no adjustments were made to the estimates provided by the pricing service, for the years ended December 31, 2018 or December 31, 2017. The classification within the fair value hierarchy is then confirmed based on the final conclusions from the pricing review.
For more information on the Company’s fair value measurements, see Note 7 to the Unaudited Consolidated Financial Statements, included elsewhere in this Report.
Deferred Policy Acquisition Costs and Value of Business Acquired
Certain direct policy acquisition costs consisting of commissions, premium taxes, and other direct underwriting expenses that vary with and are primarily related to the production of business are deferred and amortized over the effective period of the related insurance policies as the underlying policy premiums are earned.
No deferred policy acquisition costs (“DAC”) were recorded in the acquisition for Direct Auto in accordance with purchase accounting guidance. Rather, a separate intangible asset representing the value of business acquired (”VOBA”) was valued at $5,134
47
and established at the closing date. This VOBA intangible asset will be amortized into expense as the acquired unearned premiums are reported into income, in the same way as DAC. Policy acquisition costs relating to new business written by Direct Auto will be deferred following the closing date. The release of the VOBA asset and the establishment of new DAC will generally offset each other over the twelve months following the acquisition of Direct Auto.
At December 31, 2018 and 2017, deferred policy acquisition costs, the VOBA intangible asset, and the related liability for unearned premiums were as follows:
| December 31, | ||||||||
| 2018 | 2017 | |||||||
| Deferred policy acquisition costs | $ | 12,866 | $ | 8,859 | ||||
| Value of business acquired intangible asset | 1,648 | — | ||||||
| Liability for unearned premiums | 84,767 | 63,262 | ||||||
The method followed in computing deferred policy acquisition costs limits the amount of deferred costs to their estimated realizable value, which gives effect to the premium to be earned, related investment income, losses and LAE, and certain other costs expected to be incurred as the premium is earned. Future changes in estimates, the most significant of which is expected losses and LAE, may require adjustments to deferred policy acquisition costs. If the estimation of net realizable value indicates that the deferred policy acquisition costs are not recoverable, they would be written off or a premium deficiency reserve would be established.
Income Taxes
NI Holdings uses the asset and liability method of accounting for deferred income taxes. Deferred income taxes arise from the recognition of temporary differences between financial statement carrying amounts and the tax bases of our assets and liabilities. A valuation allowance is provided when it is more likely than not that some portion of the deferred income tax asset will not be realized.
NI Holdings had gross deferred income tax assets of $5,741 at December 31, 2018 and $4,279 at December 31, 2017, arising primarily from unearned premiums, loss reserve discounting, and net operating loss carryforwards. A valuation allowance is required to be established for any portion of the deferred income tax asset for which the Company believes it is more likely than not that it will not be realized. A valuation allowance of $587 and $628 was maintained at December 31, 2018 and December 31, 2017, respectively.
NI Holdings had gross deferred income tax liabilities of $5,865 at December 31, 2018 and $6,190 at December 31, 2017, arising primarily from deferred policy acquisition costs, intangible assets, and net unrealized capital gains on investments.
NI Holdings exercises significant judgment in evaluating the amount and timing of recognition of the resulting income tax liabilities and assets. These judgments require NI Holdings to make projections of future taxable income. The judgments and estimates the Company makes in determining its deferred income tax assets, which are inherently subjective, are reviewed on a continual basis as regulatory and business factors change. Any reduction in estimated future taxable income may require the Company to record a valuation allowance against its deferred income tax assets.
The effect of a change in income tax rates is recognized in the period of the enactment date. The TCJA enacted on December 22, 2017 changed the corporate income tax rate from 35% in 2017 and prior years, to 21% in 2018 and beyond. Although current income taxes payable for 2017 were not impacted, accounting guidance requires that deferred income tax assets and liabilities are re-valued upon date of enactment with the impact recorded in current year income tax expense. The impact to the Company’s deferred income taxes during 2017 was to reduce the Company’s net deferred income tax liability by $1,274, which is reflected as a reduction of income tax expense in the Consolidated Statement of Operations for the year ended December 31, 2017.
Accounting guidance provides companies the option to reclassify income tax effects that are stranded in accumulated other comprehensive income (“AOCI”) as a result of income tax reform to retained earnings. The Company accumulates unrealized gains on investments in equity with the corresponding income tax effects. The Company early adopted this guidance on a prospective basis as of December 31, 2017, and elected to reclassify material stranded income tax effects in AOCI to retained earnings using a portfolio method.
As of December 31, 2018, NI Holdings had no material unrecognized tax benefits or accrued interest and penalties. Federal income tax returns for the years 2013 through 2017 are open for examination.
48
Results of Operations
NI Holdings’ results of operations are influenced by factors affecting the property and casualty insurance and crop insurance industries in general. The operating results of the United States property and casualty industry and crop insurance industry are subject to significant variations due to competition, weather, catastrophic events, regulation changes, general economic conditions, rising medical expenses, judicial trends, fluctuations in interest rates, and other changes in the investment environment.
NI Holdings premium levels and underwriting results have been, and will continue to be, influenced by market conditions. Pricing in the property and casualty insurance industry historically has been cyclical. During a soft market cycle, price competition is more significant than during a hard market cycle and makes it difficult to attract and retain properly priced business. During a hard market cycle, it is more likely that insurers will be able to increase their rates or profit margins. A hard market typically has a positive effect on premium growth. The markets that NI Holdings serve are diversified, which requires management to regularly monitor the Company’s performance and competitive position by line of business and geographic market to schedule appropriate rate actions. We believe that the market is generally in a stable phase as different portions of the market respond to higher frequency and severity of weather-related events.
Premiums in the multi-peril crop insurance business are primarily influenced by the number of acres and types of crops insured because the pricing is set by the RMA rather than individual insurance carriers. The expected experience of this business for the calendar year may also significantly affect the reported net earned premiums and losses due to the risk-sharing arrangement with the federal government. Multi-peril crop insurance premiums are generally written in the second quarter, and earned ratably over the period of risk, which extends into the fourth quarter.
Premiums in the crop hail insurance business are also generally written in the second quarter, but earned over a shorter period of risk than multi-peril crop insurance.
Premiums in the personal lines of business (private passenger auto and home and farm) are generally written throughout the year and earned throughout the year. Losses on this business are also incurred throughout the year, but usually are more frequent and/or severe during periods of weather-related activity in the second and third quarters.
For more information on the Company’s results of operations by segment, see Note 21 to the Consolidated Financial Statements, included elsewhere in this Report.
49
Years ended December 31, 2018 and 2017
The consolidated net income for NI Holdings was $31,244 for the year ended December 31, 2018 compared to $15,612 a year ago. The major components of NI Holdings’ operating revenues and net income for the two years were as follows:
| Year Ended December 31, | ||||||||
| 2018 | 2017 | |||||||
| Revenues: | ||||||||
| Net premiums earned | $ | 195,720 | $ | 179,464 | ||||
| Fee and other income | 6,496 | 1,648 | ||||||
| Net investment income | 6,180 | 5,031 | ||||||
| Net realized capital gain on investments | 3,974 | 2,997 | ||||||
| Total revenues | $ | 212,370 | $ | 189,140 | ||||
| Components of net income: | ||||||||
| Net premiums earned | $ | 195,720 | $ | 179,464 | ||||
| Losses and loss adjustment expenses | 119,088 | 122,711 | ||||||
| Amortization of deferred policy acquisition costs and other underwriting and general expenses | 54,710 | 44,423 | ||||||
| Underwriting income | 21,922 | 12,330 | ||||||
| Fee and other income | 6,496 | 1,648 | ||||||
| Net investment income | 6,180 | 5,031 | ||||||
| Net realized capital gain on investments | 3,974 | 2,997 | ||||||
| Income before income taxes | 38,572 | 22,006 | ||||||
| Income taxes | 7,328 | 6,394 | ||||||
| Net income | $ | 31,244 | $ | 15,612 | ||||
Net Premiums Earned
NI Holdings’ net premiums earned for the year ended December 31, 2018 increased 9.1% to $195,720 compared to $179,464 a year ago.
| Year Ended December 31, | ||||||||
| 2018 | 2017 | |||||||
| Net premiums earned: | ||||||||
| Private passenger auto | $ | 62,465 | $ | 55,378 | ||||
| Non-standard auto | 27,964 | 10,530 | ||||||
| Home and farm | 64,677 | 58,395 | ||||||
| Crop | 28,699 | 43,826 | ||||||
| All other | 11,915 | 11,335 | ||||||
| Total net premiums earned | $ | 195,720 | $ | 179,464 | ||||
| Year Ended December 31, | ||||||||
| 2018 | 2017 | |||||||
| Net premiums earned: | ||||||||
| Direct premium | $ | 219,600 | $ | 189,418 | ||||
| Assumed premium | 6,514 | 6,711 | ||||||
| Ceded premium | (30,394 | ) | (16,665 | ) | ||||
| Total net premiums earned | $ | 195,720 | $ | 179,464 | ||||
Direct premiums earned for the year ended December 31, 2018 increased $30,182, or 15.9%, to $219,600 from $189,418 a year ago. Assumed premiums earned decreased slightly. Ceded premiums earned were $13,729 more in 2018 compared to 2017 due to increased ceding of 2018 crop insurance premiums back to the FCIC under the gain-sharing provision of the federal crop insurance program. The addition of the Direct Auto non-standard auto business contributed $14,516 to the net year-over-year increase of $16,256 in net premiums earned.
Our personal lines of business (private passenger auto, home and farm) continued to grow outside of North Dakota. Our non-standard auto business also grew year-over-year due to rate increases in Nevada and the addition of Direct Auto. Our crop business decreased $1,507 on a direct basis in 2018 compared to last year due to a combination of reduced acreage insured and lower commodity prices. On a net basis, crop premiums decreased $15,127 from increased ceding of premiums due to gain-sharing of favorable loss experience.
50
Losses and LAE
NI Holdings’ net losses and LAE for the year ended December 31, 2018 decreased 3.0% to $119,088 compared to $122,711 for the year ended December 31, 2017. The Company’s loss and LAE ratio decreased to 60.8% for 2018, compared to 68.4% for 2017.
| Year Ended December 31, | ||||||||
| 2018 | 2017 | |||||||
| Loss and LAE ratio: | ||||||||
| Private passenger auto | 71.3% | 62.8% | ||||||
| Non-standard auto | 51.3% | 82.5% | ||||||
| Home and farm | 66.0% | 68.0% | ||||||
| Crop | 41.5% | 74.0% | ||||||
| All other | 47.0% | 62.8% | ||||||
| Total loss and LAE ratio | 60.8% | 68.4% | ||||||
The Company’s overall loss and LAE experience significantly improved year-over-year. Private passenger auto experienced higher loss and LAE ratios due to reduced favorable claim reserve development in 2018 compared to 2017. Experience on the non-standard auto business improved from last year, and also reflects a lower loss and LAE ratio on the acquired Direct Auto business. The assumed reinsurance portion of the all other segment experience was favorable due to a relatively quiet catastrophe period in 2018, compared to a high level of hurricanes and wildfires in 2017.
Loss experience for our crop business improved considerably year-over-year. Conditions were very favorable during the 2018 growing season, and early snows and cold temperatures did not materially affect crop production through the harvest. A year ago, early season drought conditions in western North Dakota was the primary reason for the higher loss ratio.
NI Holdings realized favorable development on prior accident years of $589 in the year ended December 31, 2018, compared to $10,101 of favorable development on prior accident years realized in the year ended December 31, 2017. Net favorable development is primarily the result of prior years’ claims settling for less than originally estimated. Adjustments to our original estimates resulting from claims are not made until the period in which there is reasonable evidence that an adjustment to the reserve is appropriate.
Amortization of Deferred Policy Acquisition Costs and Other Underwriting and General Expenses
Total underwriting and general expenses, including amortization of deferred policy acquisition costs, increased $10,287 in 2018, or 23.2%, compared to 2017.
| Year Ended December 31, | ||||||||
| 2018 | 2017 | |||||||
| Underlying expenses | $ | 58,717 | $ | 44,340 | ||||
| Deferral of policy acquisition costs | (35,863 | ) | (27,667 | ) | ||||
| Other underwriting and general expenses | 22,854 | 16,673 | ||||||
| Amortization of deferred policy acquisition costs | 31,856 | 27,750 | ||||||
| Total reported expenses | $ | 54,710 | $ | 44,423 | ||||
Underlying expenses were $14,377 higher in the year ended December 31, 2018 compared to a year ago across various expense categories. Policy acquisition costs have increased due to higher written premiums. Employee costs have increased, due primarily to stock compensation costs. Consulting expenses have increased relating to technology and public company services. The new Direct Auto subsidiary contributed $5,981 of underlying expenses and $3,507 amortization of other intangibles to the current year.
Expense deferrals were $8,196 higher in 2018 than 2017 due to the increase in direct premiums written in 2018, whereas amortization of those costs was $4,106 higher in 2018 due to the increase in direct premiums earned in 2018. The net increase in deferrals is primarily due to the establishment of deferred policy acquisition costs on new business for Direct Auto after the acquisition.
The expense ratio of 28.0% for the year ended December 31, 2018 was 3.2 percentage points higher than a year ago, due to the higher policy acquisition costs, higher consulting services and share-based compensation, and the increased ceding of crop insurance premiums. The Direct Auto business model, which includes a higher level of expenses offset by lower losses and LAE than the Primero business model, also contributes to a higher expense ratio.
51
Underwriting Gain (Loss)
Underwriting gain (loss) measures the pretax profitability of a company’s insurance business. It is derived by subtracting losses and LAE, amortization of deferred policy acquisition costs, and other underwriting and general expenses from net premiums earned.
| Year Ended December 31, | ||||||||
| 2018 | 2017 | |||||||
| Underwriting gain (loss): | ||||||||
| Private passenger auto | $ | (589 | ) | $ | 3,739 | |||
| Non-standard auto | 3,500 | (1,217 | ) | |||||
| Home and farm | 2,012 | 500 | ||||||
| Crop | 13,611 | 6,959 | ||||||
| All other | 3,388 | 2,349 | ||||||
| Total underwriting gain | $ | 21,922 | $ | 12,330 | ||||
The underwriting results for all of our business segments improved significantly year-over-year, other than the private passenger auto business. The private passenger auto business benefited from a higher amount of favorable claim reserve development in 2017 compared to 2018.
Rate increases and other underwriting actions on our Primero non-standard auto business reduced the underwriting loss considerably from a year ago. Fee income attributable to this segment is a key component in measuring its profitability. The new Direct Auto non-standard auto business is expected to experience a lower loss and LAE ratio while generating only minimal fee income. Fee income on the non-standard auto business was $1,406 and $1,087 for the years ended December 31, 2018 and 2017, respectively.
The underwriting results on our crop insurance business are significantly improved compared to a year ago. In 2017, higher loss experience was reported due to the early season drought conditions in western North Dakota. In 2018, favorable growing conditions reduced our loss experience considerably, which was partially offset by increased gain-sharing of profits back to the FCIC.
Fee and Other Income
NI Holdings had fee and other income of $6,496 for the year ended December 31, 2018, compared to $1,648 for the year ended December 31, 2017. The majority of fee income is typically attributable to the fees charged in Primero’s non-standard auto business, and increased year-over-year due to growth of the business. However, in the third quarter of 2018, the Company recognized a pre-tax gain of $4,578 as part of other income as a result of the purchase accounting afforded the purchase of Direct Auto.
Net Investment Income
The following table sets forth our average cash and invested assets, net investment income, and return on average cash and invested assets for the reported periods:
| Year Ended December 31, | ||||||||
| 2018 | 2017 | |||||||
| Weighted average cash and invested assets | $ | 337,407 | $ | 283,354 | ||||
| Gross investment income | $ | 8,384 | $ | 7,069 | ||||
| Investment expenses | 2,204 | 2,038 | ||||||
| Net investment income | $ | 6,180 | $ | 5,031 | ||||
| Gross return on average cash and invested assets | 2.5% | 2.5% | ||||||
| Net return on average cash and invested assets | 1.8% | 1.8% | ||||||
Investment income, net of investment expense, increased $1,149 for the year ended December 31, 2018 compared to 2017. This increase is attributable to an increase in invested assets caused the timing of the investment actions taken with respect to the receipt of the proceeds of over $90 million from the Company’s initial public offering in March 2017. Cash and invested assets also increased a net $53,533 in September 2018 from the acquisition of Direct Auto. The majority of Direct Auto cash and invested assets was in short term cash and cash equivalents at the closing date. The weighted average gross yield on invested assets remained level of 2.5% in 2018 compared to 2017.
52
Net Realized Capital Gain on Investments
NI Holdings had net realized capital gains on investment of $3,974 for the year ended December 31, 2018, compared to $2,997 for the year ended December 31, 2017. The Company recorded $382 and $330 of other-than-temporary impairments during the years ended December 31, 2018 and 2017, respectively.
The Company’s fixed income securities and equity securities are classified as available for sale because it will, from time to time, make sales of securities that are not impaired, consistent with our investment goals and policies. At December 31, 2018, the Company had net unrealized losses on fixed income securities of $2,325 and net unrealized gains on equity securities of $10,359. At December 31, 2017, the Company had net unrealized gains on fixed income securities of $1,780 and net unrealized gains on equity securities of $18,533. The decrease in the fair value of our fixed income securities is attributable to a general rise in the interest rate environment during 2018. The decrease in the fair value of our equity securities is attributable to a general decline in the overall stock market during December 2018.
NI Holdings has evaluated each security in a loss position and taken into account the severity and duration of the impairment, the current rating on the bond, and the outlook for the issuer according to independent analysts. NI Holdings believes that the foregoing declines in fair value in its existing portfolio are most likely attributable to short-term market trends and there is no evidence that the Company will not recover the entire amortized cost basis.
Income before Income Taxes
For the year ended December 31, 2018, NI Holdings had pre-tax income of $38,572 compared to pre-tax income of $22,006 for the year ended December 31, 2017. The increase in pre-tax income was largely attributable to favorable loss experience in our crop business and our all other segment, the gain realized as a result of the purchase accounting afforded the acquisition of Direct Auto, and favorable operating results from Direct Auto.
Income Taxes
NI Holdings recorded income tax expense of $7,328 for the year ended December 31, 2018, compared to $6,394 of income tax expense for the year ended December 31, 2017. Our effective tax rate for 2018 was 19.0% compared to an effective tax rate of 29.1% for 2017. Reported tax expense in 2017 included $568 of additional income tax expense related to the handling of expenses associated with the Company’s mutual to stock conversion and initial public offering and a $1,274 reduction of income tax expense due to a new corporate income tax rate of 21% for tax years 2018 and beyond, enacted on December 22, 2017. The previous tax rate was 35% for 2017 and prior.
Accounting guidance requires that companies re-measure existing deferred income tax assets (including loss carryforwards) and liabilities in the period of enactment of a tax rate change. The guidance also requires any change to a previously recorded valuation allowance as a result of re-measuring existing temporary differences and loss carryforwards to be recognized in the period of enactment. The resulting impact on our deferred income taxes and the related valuation allowance was recognized in the fourth quarter of 2017. The valuation allowance against certain deferred income tax assets decreased to $587 at December 31, 2018 from $628 at December 31, 2017.
Net Income
For the year ended December 31, 2018, NI Holdings had net income before non-controlling interest of $31,244 compared to net income before non-controlling interest of $15,612 for 2017. This increase in net income was primarily attributable to favorable loss experience in our crop business and our all other segment, the gain realized as a result of the purchase accounting afforded the acquisition of Direct Auto, and favorable operating results from Direct Auto.
Return on Average Equity
For the year ended December 31, 2018, NI Holdings had annualized return on average equity, after non-controlling interest, of 11.8% compared to annualized return on average equity, after non-controlling interest, of 7.9% for the year ended December 31, 2017. Average equity is calculated as the average between beginning and ending equity excluding non-controlling interest for the period.
53
Years ended December 31, 2017 and 2016
The consolidated net income for NI Holdings was $15,612 for the year ended December 31, 2017 compared to $4,638 a year ago. The major components of NI Holdings’ operating revenues and net income for the two years were as follows:
| Year Ended December 31, | ||||||||
| 2017 | 2016 | |||||||
| Revenues: | ||||||||
| Net premiums earned | $ | 179,464 | $ | 152,756 | ||||
| Fee and other income | 1,648 | 1,666 | ||||||
| Net investment income | 5,031 | 3,644 | ||||||
| Net realized capital gain on investments | 2,997 | 5,681 | ||||||
| Total revenues | $ | 189,140 | $ | 163,747 | ||||
| Components of net income: | ||||||||
| Net premiums earned | $ | 179,464 | $ | 152,756 | ||||
| Losses and loss adjustment expenses | 122,711 | 118,508 | ||||||
| Amortization of deferred policy acquisition costs and other underwriting and general expenses | 44,423 | 39,122 | ||||||
| Underwriting gain (loss) | 12,330 | (4,874 | ) | |||||
| Fee and other income | 1,648 | 1,666 | ||||||
| Net investment income | 5,031 | 3,644 | ||||||
| Net realized capital gain on investments | 2,997 | 5,681 | ||||||
| Income before income taxes | 22,006 | 6,117 | ||||||
| Income taxes | 6,394 | 1,479 | ||||||
| Net income | $ | 15,612 | $ | 4,638 | ||||
Net Premiums Earned
NI Holdings’ net premiums earned for the year ended December 31, 2017 increased 17.5% to $179,464 compared to $152,756 for the year ended December 31, 2016.
| Year Ended December 31, | ||||||||
| 2017 | 2016 | |||||||
| Net premiums earned: | ||||||||
| Private passenger auto | $ | 55,378 | $ | 48,250 | ||||
| Non-standard auto | 10,530 | 10,671 | ||||||
| Home and farm | 58,395 | 50,243 | ||||||
| Crop | 43,826 | 33,163 | ||||||
| All other | 11,335 | 10,429 | ||||||
| Total net premiums earned | $ | 179,464 | $ | 152,756 | ||||
| Year Ended December 31, | ||||||||
| 2017 | 2016 | |||||||
| Net premiums earned: | ||||||||
| Direct premium | $ | 189,418 | $ | 176,958 | ||||
| Assumed premium | 6,711 | 6,546 | ||||||
| Ceded premium | (16,665 | ) | (30,748 | ) | ||||
| Total net premiums earned | $ | 179,464 | $ | 152,756 | ||||
Private passenger auto, as well as home and farm, continued to grow outside of North Dakota. Both segments were favorably impacted by lower ceding of premiums due to a higher retention amount in our catastrophe reinsurance program in 2017. Our non-standard auto business was relatively flat year-over-year as rate increases were needed in Nevada to cover the higher losses experienced in this business. Our crop business experienced higher losses in 2017, which reduced the level of premium sharing required with the federal government on relatively flat direct premiums earned.
54
Losses and LAE
NI Holdings’ net losses and LAE for the year ended December 31, 2017 increased 3.6% to $122,711 compared to $118,508 for the year ended December 31, 2016. The Company’s loss and LAE ratio decreased to 68.4% for 2017, compared to 77.6% for 2016.
| Year Ended December 31, | ||||||||
| 2017 | 2016 | |||||||
| Loss and LAE ratio: | ||||||||
| Private passenger auto | 62.8% | 78.5% | ||||||
| Non-standard auto | 82.5% | 93.4% | ||||||
| Home and farm | 68.0% | 87.6% | ||||||
| Crop | 74.0% | 58.4% | ||||||
| All other | 62.8% | 69.8% | ||||||
| Total loss and LAE ratio | 68.4% | 77.6% | ||||||
Private passenger auto business, and home and farm business, experienced fewer weather related losses in 2017 compared to 2016, particularly in North Dakota. Our non-standard auto business improved from a year ago as a result of strategic pricing and underwriting actions.
A very dry start to the 2017 growing season increased our loss experience for the multi-peril crop business when compared to prior years. The loss and LAE ratio for the entire year ended December 31, 2017 came in line with average expectations, which provided a normal level of premium retention under the risk-sharing arrangement with the federal government compared to a year ago.
In the all other segment, the assumed reinsurance book of business was adversely impacted by hurricanes Harvey, Irma, and Maria during the third quarter of 2017, and by the California wildfires during the fourth quarter of 2017. This adverse experience was more than offset by improvements in excess liability and commercial multi-peril coverages.
NI Holdings realized favorable development on prior accident years of $10,101 in 2017, compared to $4,756 of favorable development on prior accident years realized in 2016. Net favorable development is primarily the result of prior years’ claims settling for less than originally estimated. Adjustments to our original estimates resulting from claims are not made until the period in which there is reasonable evidence that an adjustment to the reserve is appropriate.
Amortization of Deferred Policy Acquisition Costs and Other Underwriting and General Expenses
Total underwriting and general expenses, including amortization of deferred policy acquisition costs, increased $5,301 in 2017, or 13.6%, compared to 2016. Expenses were higher in 2017 due to increased commissions and other policy acquisition costs as a result of increased premiums written. In addition, as a new public company, additional expenses were incurred due to increased salaries, legal and accounting costs, taxes and fees, and holding company costs. The expense ratio of 24.8% for the year ended December 31, 2017 was 0.8% less than the expense ratio in 2016, primarily due to higher net premiums earned in 2017.
Underwriting Gain (Loss)
Underwriting gain (loss) measures the pretax profitability of a company’s insurance business. It is derived by subtracting losses and LAE, amortization of deferred policy acquisition costs, and other underwriting and general expenses from net premiums earned.
| Year Ended December 31, | ||||||||
| 2017 | 2016 | |||||||
| Underwriting gain (loss): | ||||||||
| Private passenger auto | $ | 3,739 | $ | (3,595 | ) | |||
| Non-standard auto | (1,217 | ) | (2,215 | ) | ||||
| Home and farm | 500 | (9,582 | ) | |||||
| Crop | 6,959 | 9,269 | ||||||
| All other | 2,349 | 1,249 | ||||||
| Total underwriting gain (loss) | $ | 12,330 | $ | (4,874 | ) | |||
The underwriting results for our both our private passenger auto business and our home and farm business improved significantly year-over-year. The year ended December 31, 2016 included a high number of weather related events that generated underwriting losses. Strategic rating and underwriting actions across the personal lines of business, along with an average year of weather related losses, helped to bring those lines back to profitability.
55
Rate increases and other underwriting actions on our non-standard auto business reduced the underwriting loss considerably from a year ago. Fee income attributable to this segment is a key component in measuring its profitability. Fee income on this business was $1,087 and $1,157 for the years ended December 31, 2017 and 2016, respectively.
The crop insurance business generated a lower underwriting gain for 2017 compared to 2016. While loss experience was higher for 2017, premium retention under the risk-sharing arrangement with the federal government was also higher to offset most of the increased loss experience.
Underwriting results for the all other segment increased in 2017 due to improvements in the commercial multi-peril and excess liability businesses, partially offset by the impacts of the hurricane and wildfire activity in our assumed reinsurance business.
Fee and Other Income
NI Holdings had fee and other income of $1,648 for the year ended December 31, 2017, compared to $1,666 for the year ended December 31, 2016. The majority of fee income is attributable to the non-standard auto insurance business.
Net Investment Income
The following table sets forth our average cash and invested assets, investment income, and return on average cash and invested assets for the reported periods:
| Year Ended December 31, | ||||||||
| 2017 | 2016 | |||||||
| Weighted average cash and invested assets | $ | 283,354 | $ | 203,412 | ||||
| Gross investment income | $ | 7,069 | $ | 5,460 | ||||
| Investment expenses | 2,038 | 1,816 | ||||||
| Net investment income | $ | 5,031 | $ | 3,644 | ||||
| Gross return on average cash and invested assets | 2.5% | 2.7% | ||||||
| Net return on average cash and invested assets | 1.8% | 1.8% | ||||||
Investment income, net of investment expense, increased $1,387 for the year ended December 31, 2017 compared to 2016. This increase is attributable to an increase in invested assets, as cash and invested assets increased to $313,885 at December 31, 2017 from $207,677 at December 31, 2016, primarily as a result of the proceeds from the Company’s IPO. The weighted average gross yield on invested assets decreased to 2.5% in 2017 compared to 2.7% in 2017.
Net Realized Capital Gain on Investments
NI Holdings had realized capital gains on investment of $2,997 for the year ended December 31, 2017, compared to $5,681 for the year ended December 31, 2016. The Company recorded other-than-temporary impairments of $330 in the year ended December 31, 2017, and no other-than-temporary impairments in the year ended December 31, 2016.
The Company’s fixed income securities and equity securities are classified as available for sale because it will, from time to time, make sales of securities that are not impaired, consistent with our investment goals and policies. At December 31, 2017, the Company had net unrealized gains on fixed income securities of $1,780 and net unrealized gains on equity securities of $18,533. At December 31, 2016, the Company had net unrealized gains on fixed income securities of $1,210 and net unrealized gains on equity securities of $14,406.
NI Holdings has evaluated each security in a loss position and taken into account the severity and duration of the impairment, the current rating on the bond, and the outlook for the issuer according to independent analysts. NI Holdings believes that the foregoing declines in fair value in its existing portfolio are most likely attributable to short-term market trends and there is no evidence that it will not recover the entire amortized cost basis.
Income before Income Taxes
For the year ended December 31, 2017, NI Holdings had pre-tax income of $22,006 compared to pre-tax income of $6,117 for the year ended December 31, 2016. The increase in pre-tax income was largely attributable to the decrease in losses and LAE on the private passenger auto and home and farm lines of business when compared to the higher level of weather related losses in 2016.
56
Income Taxes
NI Holdings recorded income tax expense of $6,394 for the year ended December 31, 2017, compared to $1,479 of income tax expense for the year ended December 31, 2016. Income tax expense for 2017 included $568 of additional income tax expense related to the handling of expenses associated with the Company’s mutual to stock conversion and initial public offering and a reduction of $1,274 to income tax expense due to a new corporate income tax rate of 21% for tax years 2018 and beyond, enacted on December 22, 2017. Accounting guidance requires that companies re-measure existing deferred tax assets (including loss carryforwards) and liabilities and record an offset for the net amount as a component of income tax expense from continuing operations in the period of enactment. Any change to a previously recorded valuation allowance as a result of re-measuring existing temporary differences and loss carryforward should also be reflected as a component of income tax expense from continuing operations. In addition, the valuation allowance against certain deferred income tax assets decreased by $394 to $628 at December 31, 2017 from $1,022 at December 31, 2016.
Our effective tax rate for 2017 was 29.1% compared to an effective tax rate of 24.2% for 2016. The increase in the effective tax rate was the result of a lesser impact of comparable permanent tax adjustments realized on a higher income before income taxes amount for 2017.
Net Income
For the year ended December 31, 2017, NI Holdings had net income before non-controlling interest of $15,612 compared to net income before non-controlling interest of $4,638 for 2016. This increase in net income was primarily attributable to decreased losses and LAE in the Company’s private passenger auto and home and farm lines of business, when compared to a higher level of weather related losses in 2016.
Return on Average Equity
For the year ended December 31, 2017, NI Holdings had annualized return on average equity, after non-controlling interest, of 7.9% compared to annualized return on average equity, after non-controlling interest, of 3.1% for the year ended December 31, 2016. Average equity is calculated as the average between beginning and ending equity excluding non-controlling interest for the year.
57
Financial Position
The major components of NI Holdings’ financial position are as follows:
| December 31, | ||||||||
| 2018 | 2017 | |||||||
| Assets | ||||||||
| Cash and investments | $ | 374,371 | $ | 313,885 | ||||
| Premiums and agents’ balances receivable | 34,287 | 25,632 | ||||||
| Deferred policy acquisition costs | 12,866 | 8,859 | ||||||
| Other assets | 36,968 | 28,612 | ||||||
| Total assets | $ | 458,492 | $ | 376,988 | ||||
| Liabilities | ||||||||
| Unpaid losses and loss adjustment expenses | $ | 87,121 | $ | 45,890 | ||||
| Unearned premiums | 84,767 | 63,262 | ||||||
| Other liabilities | 10,851 | 12,263 | ||||||
| Total liabilities | 182,739 | 121,415 | ||||||
| Equity | 275,753 | 255,573 | ||||||
| Total liabilities and equity | $ | 458,492 | $ | 376,988 | ||||
At December 31, 2018, NI Holdings had total assets of $458,492, an increase of $81,504, or 21.6%, from December 31, 2017. The acquisition of Direct Auto on August 31, 2018 added $70,533 in cash and investments, $5,849 of premium-related receivables, and $5,502 of intangible assets. Consideration paid for Direct Auto was $17,000. Receivables from policyholders increased due to growth in the business, and the receivable from the FCIC increased $5,668 from year to year due to improved loss experience on the multi-peril crop insurance business. Deferred policy acquisition costs also increased due to growth in the business and the addition of Direct Auto.
At December 31, 2018, total liabilities were $182,739, an increase of $61,324, or 50.5%, from December 31, 2017. The acquisition of Direct Auto on August 31, 2018 added $40,967 of unpaid losses and LAE as well as $15,955 of unearned premiums.
Total equity increased by $20,180, or 7.9%, during the year ended December 31, 2018. The increase in equity primarily reflects consolidated net income of $31,244 for the year, partially offset by a $9,700 decrease in accumulated other comprehensive income due to lower fair values within our investment portfolio caused by an increase in the interest rate environment and a general decrease in the stock market during December 2018.
Liquidity and Capital Resources
NI Holdings generates sufficient funds from its operations and maintains a high degree of liquidity in its investment portfolio to meet the demands of claim settlements and operating expenses. The primary sources of funds are premium collections, investment earnings, and maturing investments. In 2017, we raised $93,145 in net proceeds from our initial public offering, which are available if necessary to meet the demands of claim settlements and operating expenses. In 2018, we used $17,000 for the acquisition of Direct Auto.
The Company’s philosophy is to provide sufficient cash flows from operations to meet its obligations in order to minimize the forced sales of investments. The Company maintains a portion of its investment portfolio in relatively short-term and highly liquid assets to ensure the availability of funds.
The change in cash and cash equivalents for the years ended December 31, 2018, 2017, and 2016 were as follows:
| Year Ended December 31, | ||||||||||||
| 2018 | 2017 | 2016 | ||||||||||
| Cash flows provided by operating activities | $ | 20,955 | $ | 18,425 | $ | 7,307 | ||||||
| Cash flows provided by (used in) investing activities | 23,397 | (91,857 | ) | (3,510 | ) | |||||||
| Cash flows (used in) provided by financing activities | (2,996 | ) | 82,708 | — | ||||||||
| Net increase in cash and cash equivalents | $ | 41,356 | $ | 9,276 | $ | 3,797 | ||||||
58
For the year ended December 31, 2018, net cash provided by operating activities totaled $20,955 compared to $18,425 a year ago. Consolidated net income of $31,244 for the year ended December 31, 2018 compared to $15,612 for the same period a year ago. Excluding the amounts directly attributed to the acquisition of Direct Auto, changes to the receivable from FCIC and federal income tax recoverable/payable offset the change to net income to result in only a modest change in cash flows provided by operating activities between 2018 and 2017.
Net cash provided by investing activities totaled $23,397 for the year ended December 31, 2018, compared to $91,857 net cash used in investing activities a year ago. The net cash provided in 2018 primarily relates to the acquisition of Direct Auto as the purchase price of $17,000 was more than offset by the cash and cash equivalents acquired in connection with the purchase ($44,485). The net cash used in 2017 primarily resulted from the opportunity to invest the excess cash raised from our initial public offering.
Net cash used in financing activities was $2,996 for the year ended December 31, 2018, and was attributable to the purchase of treasury stock. Net cash provided by financing activities of $82,708 for the year ended December 31, 2017 reflects the net proceeds from our initial public offering, offset by the initial funding of our new employee stock option plan and the purchase of treasury stock.
For the year ended December 31, 2017, net cash provided by operating activities totaled $18,425 compared to $7,307 for the year ended December 31, 2016. The Company reduced its levels of reinsurance receivables and collected more unearned premiums for the year ended December 31, 2017 compared to the year ended December 31, 2016, while net income increased significantly from 2016. Net cash used in investing activities totaled $91,857 for the year ended December 31, 2017, compared to net cash used of $3,510 in the year ended December 31, 2016, primarily reflecting the opportunity to invest the proceeds from the common stock offering in longer-term investments in 2017. Net cash provided by financing activities of $82,708 for the year ended December 31, 2017 reflect the net proceeds from our initial public offering, offset by the initial funding of our new employee stock option plan and the repurchase of treasury stock for $8,037.
As a standalone entity, and outside of the net proceeds from the recent initial public offering, NI Holdings’ principal source of long-term liquidity will be dividend payments from Nodak Insurance and Direct Auto.
Nodak Insurance will be restricted by the insurance laws of North Dakota as to the amount of dividends or other distributions it may pay to NI Holdings. North Dakota law sets the maximum amount of dividends that may be paid by Nodak Insurance during any twelve-month period after notice to, but without prior approval of, the North Dakota Insurance Department. This amount cannot exceed the lesser of (i) 10% of the Company’s surplus as regards policyholders as of the preceding December 31, or (ii) the Company’s statutory net income for the preceding calendar year (excluding realized capital gains), less any prior dividends paid during such twelve-month period. In addition, any insurance company other than a life insurance company may carry forward net income from the preceding two calendar years, not including realized capital gains, less any dividends actually paid during those two calendar years. Dividends in excess of this amount are considered “extraordinary” and are subject to the approval of the North Dakota Insurance Department.
The amount available for payment of dividends from Nodak Insurance to us during 2019 without the prior approval of the North Dakota Insurance Department is approximately $17,588 based upon the policyholders’ surplus of Nodak Insurance at December 31, 2018. Prior to its payment of any extraordinary dividend, Nodak Insurance will be required to provide notice of the dividend to the North Dakota Insurance Department. This notice must be provided to the North Dakota Insurance Department 30 days prior to the payment of an extraordinary dividend and 10 days prior to the payment of an ordinary dividend. The North Dakota Insurance Department has the power to limit or prohibit dividend payments if an insurance company is in violation of any law or regulation. These restrictions or any subsequently imposed restrictions may affect our future liquidity. No dividends were declared or paid by Nodak Insurance during the years ended December 31, 2018 or 2017.
Direct Auto will be restricted by the insurance laws of Illinois as to the amount of dividends or other distributions it may pay to NI Holdings. Illinois law sets the maximum amount of dividends that may be paid by Direct Auto during any twelve-month period after notice to, but without prior approval of, the Illinois Department of Insurance. This amount cannot exceed the greater of (i) 10% of the Company’s surplus as regards policyholders as of the preceding December 31, or (ii) the Company’s statutory net income for the preceding calendar year (excluding realized capital gains). Dividends in excess of this amount are considered “extraordinary” and are subject to the approval of the Illinois Department of Insurance.
The amount available for payment of dividends from Direct Auto to NI Holdings during 2019 without the prior approval of the Illinois Department of Insurance is $6,653 based upon the policyholders’ surplus of Direct Auto at December 31, 2018. Prior to its payment of any dividend, Direct Auto will be required to provide notice of the dividend to the Illinois Department of Insurance. This notice must be provided to the Illinois Department of Insurance within five business days following declaration of any dividend and no less than 30 days prior to the payment of an extraordinary dividend or 10 days prior to the payment of an ordinary dividend. The Illinois Department of Insurance has the power to limit or prohibit dividend payments if Direct Auto is in violation of any law or regulation. These restrictions or any subsequently imposed restrictions may affect our future liquidity. No dividends were declared or paid by Direct Auto during the year ended December 31, 2018.
59
As a public company, NI Holdings is subject to the proxy solicitation, periodic reporting, insider trading, and other requirements of the Exchange Act and to most of the provisions of the Sarbanes-Oxley Act of 2002. As a result, NI Holdings anticipates incurring higher levels of expenses related to accounting and legal services that will be necessary to comply with such requirements.
Contractual Obligations Table
The following table summarizes, as of December 31, 2018, NI Holdings’ future payments and estimated claims and claims related payments for continuing operations.
| Payments Due by Period | ||||||||||||||||||||
| Contractual Obligations | Total | Less than 1 year | 1 – 3 years | 3 – 5 years | More than 5 years | |||||||||||||||
| Estimated gross loss & LAE payments | $ | 87,121 | $ | 46,789 | $ | 24,945 | $ | 10,031 | $ | 5,356 | ||||||||||
| Operating lease obligations | 572 | 301 | 181 | 90 | — | |||||||||||||||
| Total | $ | 87,693 | $ | 47,090 | $ | 25,126 | $ | 10,121 | $ | 5,356 | ||||||||||
The timing of the amounts of the gross loss and LAE payments is an estimate based on historical experience and the expectations of future payment patterns. The actual timing and amounts of these payments in the future may vary from the amounts stated above.
Off-Balance Sheet Arrangements
NI Holdings has no significant off-balance sheet arrangements that have or are reasonably likely to have a current or future effect on its financial condition, changes in financial condition, revenues or expenses, results of operations, liquidity, capital expenditures, or capital reserves.
Recent Accounting Pronouncements
For a discussion of recent accounting pronouncements, see Note 5 to the Consolidated Financial Statements, included elsewhere in this Report.
| Item 7A. | Quantitative and Qualitative Information about Market Risk |
Market Risk
Market risk is the risk that a company will incur losses due to adverse changes in the fair value of financial instruments. NI Holdings has exposure to three principal types of market risk through its investment activities: interest rate risk, credit risk, and equity risk. NI Holdings’ primary market risk exposure is to changes in interest rates. NI Holdings has not entered, and does not plan to enter, into any derivative financial instruments for hedging, trading, or speculative purposes.
Interest Rate Risk
Interest rate risk is the risk that a company will incur economic losses due to adverse changes in interest rates. NI Holdings’ exposure to interest rate changes primarily results from its significant holdings of fixed income securities. Fluctuations in interest rates have a direct impact on the fair value of these securities.
The portfolio duration of the fixed income securities in NI Holdings’ investment portfolio at December 31, 2018, excluding Direct Auto, was 3.46 years. The Company’s fixed income securities include U.S. government bonds, securities issued by government agencies, obligations of state and local governments and governmental authorities, and corporate bonds, most of which are exposed to changes in prevailing interest rates and which may experience moderate fluctuations in fair value resulting from changes in interest rates. NI Holdings carries these investments as available for sale. This allows the Company to manage its exposure to risks associated with interest rate fluctuations through active review of its investment portfolio by its management and Board of Directors and consultation with our outside investment manager.
60
Fluctuations in near-term interest rates could have an impact on NI Holdings’ results of operations and cash flows. Certain of these securities may have call features. In a declining interest rate environment, these securities may be called by their issuer and replaced with securities bearing lower interest rates. If NI Holdings is required to sell these securities in a rising interest rate environment, it may recognize investment losses.
As a general matter, NI Holdings attempts to match the durations of its assets with the durations of its liabilities. The Company’s investment objectives include maintaining adequate liquidity to meet its operational needs, optimizing its after-tax investment income, and its after-tax total return, all of which are subject to NI Holdings’ tolerance for risk.
The table below shows the interest rate sensitivity of NI Holdings’ fixed income securities, excluding the Direct Auto portfolio, measured in terms of fair value (which is equal to the carrying value for all of its investment securities that are subject to interest rate changes) at December 31, 2018:
| Hypothetical Change in Interest Rate | Estimated Change in Fair Value | Fair Value | ||||||
| 200 basis point increase | $ | (17,777 | ) | $ | 225,193 | |||
| 100 basis point increase | (8,887 | ) | 234,083 | |||||
| No change | — | 242,970 | ||||||
| 100 basis point decrease | 8,293 | 251,263 | ||||||
| 200 basis point decrease | 16,402 | 259,372 | ||||||
Credit Risk
Credit risk is the potential economic loss principally arising from adverse changes in the financial condition of a specific debt issuer. NI Holdings addresses this risk by investing primarily in fixed income securities that are rated at least investment grade by Moody’s or an equivalent rating quality. NI Holdings also independently, and through its outside investment manager, monitors the financial condition of all of the issuers of fixed income securities in the portfolio. To limit its exposure to risk, the Company employs diversification rules that limit the credit exposure to any single issuer or asset class.
Equity Risk
Equity price risk is the risk that NI Holdings will incur economic losses due to adverse changes in equity prices.
Impact of Inflation
Inflation increases consumers’ needs for property and casualty insurance due to the increase in the value of the property insured and any potential liability exposure. Inflation also increases claims incurred by property and casualty insurers as property repairs, replacements, and medical expenses increase. These cost increases reduce profit margins to the extent that rate increases are not implemented on an adequate and timely basis. NI Holdings establishes insurance premiums levels before the amount of losses and LAE, or the extent to which inflation may affect these expenses, are known. Therefore, NI Holdings attempts to anticipate the potential impact of inflation when establishing rates. Because inflation has remained relatively low in recent years, financial results have not been significantly affected by it.
61
| Item 8. | Financial Statements and Supplementary Data |
REPORT OF INDEPENDENT REGISTERED PUBLIC ACCOUNTING FIRM
To the Shareholders and Board of Directors of NI Holdings, Inc.
Opinion on the Financial Statements
We have audited the accompanying consolidated balance sheets of NI Holdings, Inc. and Subsidiaries (collectively, the “Company”) as of December 31, 2018 and 2017, and the related consolidated statements of operations, comprehensive income, changes in equity, and cash flows for each of the three years in the period ended December 31, 2018, and the related notes and the schedule listed in Item 15(a)(2) (collectively referred to as the “consolidated financial statements”). In our opinion, the consolidated financial statements present fairly, in all material respects, the consolidated financial position of the Company as of December 31, 2018 and 2017, and the results of its operations and its cash flows for each of the three years in the period ended December 31, 2018, in conformity with accounting principles generally accepted in the United States of America.
Basis for Opinion
These consolidated financial statements are the responsibility of the Company’s management. Our responsibility is to express an opinion on the Company’s consolidated financial statements based on our audits. We are a public accounting firm registered with the Public Company Accounting Oversight Board (United States) (“PCAOB”) and are required to be independent with respect to the Company in accordance with the U.S. federal securities laws and the applicable rules and regulations of the Securities and Exchange Commission and the PCAOB.
We conducted our audits in accordance with the standards of the PCAOB. Those standards require that we plan and perform the audit to obtain reasonable assurance about whether the consolidated financial statements are free of material misstatement, whether due to error or fraud. The Company is not required to have, nor were we engaged to perform, an audit of its internal control over financial reporting. As part of our audits we are required to obtain an understanding of internal controls over financial reporting but not for the purpose of expressing an opinion on the effectiveness of the Company’s internal control over financial reporting. Accordingly, we express no such opinion.
Our audits included performing procedures to assess the risks of material misstatement of the consolidated financial statements, whether due to error or fraud, and performing procedures that respond to those risks. Such procedures included examining, on a test basis, evidence regarding the amounts and disclosures in the consolidated financial statements. Our audits also included evaluating the accounting principles used and significant estimates made by management, as well as evaluating the overall presentation of the financial statements. We believe that our audits provide a reasonable basis for our opinion.
/s/ Mazars USA LLP
We have served as the Company’s auditor since February 2016.
Fort Washington, Pennsylvania
March 13, 2019
62
NI Holdings, Inc.
December 31, 2018 and 2017
(dollar amounts in thousands, except par value)
| 2018 | 2017 | |||||||
| Assets: | ||||||||
| Cash and cash equivalents | $ | 68,950 | $ | 27,594 | ||||
| Fixed income securities, at fair value | 254,969 | 236,758 | ||||||
| Equity securities, at fair value | 48,498 | 47,561 | ||||||
| Other investments | 1,954 | 1,972 | ||||||
| Total cash and investments | 374,371 | 313,885 | ||||||
| Premiums and agents' balances receivable | 34,287 | 25,632 | ||||||
| Deferred policy acquisition costs | 12,866 | 8,859 | ||||||
| Reinsurance recoverables on losses | 2,232 | 4,128 | ||||||
| Accrued investment income | 1,898 | 1,996 | ||||||
| Property and equipment | 6,979 | 5,877 | ||||||
| Receivable from Federal Crop Insurance Corporation | 16,169 | 10,501 | ||||||
| Goodwill and other intangibles | 4,623 | 2,628 | ||||||
| Other assets | 5,067 | 3,482 | ||||||
| Total assets | $ | 458,492 | $ | 376,988 | ||||
| Liabilities: | ||||||||
| Unpaid losses and loss adjustment expenses | $ | 87,121 | $ | 45,890 | ||||
| Unearned premiums | 84,767 | 63,262 | ||||||
| Reinsurance premiums payable | — | 428 | ||||||
| Federal income tax payable | 197 | 991 | ||||||
| Deferred income taxes, net | 711 | 2,539 | ||||||
| Accrued expenses and other liabilities | 9,943 | 8,305 | ||||||
| Commitments and contingencies | — | — | ||||||
| Total liabilities | 182,739 | 121,415 | ||||||
| Equity: | ||||||||
| Common stock, $0.01 par value, authorized 25,000,000 shares, issued: 23,000,000 shares; and outstanding: 2018 – 22,192,894 shares, 2017 – 22,337,644 shares | 230 | 230 | ||||||
| Preferred stock, without par value, authorized 5,000,000 shares, no shares issued or outstanding | — | — | ||||||
| Additional paid-in capital | 94,486 | 93,496 | ||||||
| Unearned employee stock ownership plan shares | (1,914 | ) | (2,157 | ) | ||||
| Retained earnings | 183,946 | 152,865 | ||||||
| Accumulated other comprehensive income, net of income taxes | 6,376 | 15,998 | ||||||
| Treasury stock, at cost, 2018 – 615,736 shares, 2017 – 446,671 shares | (10,634 | ) | (8,037 | ) | ||||
| Non-controlling interest | 3,263 | 3,178 | ||||||
| Total equity | 275,753 | 255,573 | ||||||
| Total liabilities and equity | $ | 458,492 | $ | 376,988 | ||||
The accompanying notes are an integral part of these consolidated financial statements.
63
NI Holdings, Inc.
Consolidated Statements of Operations
Years Ended December 31, 2018, 2017 and 2016
(dollar amounts in thousands, except per share data)
| 2018 | 2017 | 2016 | ||||||||||
| Revenues: | ||||||||||||
| Net premiums earned | $ | 195,720 | $ | 179,464 | $ | 152,756 | ||||||
| Fee and other income | 6,496 | 1,648 | 1,666 | |||||||||
| Net investment income | 6,180 | 5,031 | 3,644 | |||||||||
| Net realized capital gain on investments | 3,974 | 2,997 | 5,681 | |||||||||
| Total revenues | 212,370 | 189,140 | 163,747 | |||||||||
| Expenses: | ||||||||||||
| Losses and loss adjustment expenses | 119,088 | 122,711 | 118,508 | |||||||||
| Amortization of deferred policy acquisition costs | 31,856 | 27,750 | 20,423 | |||||||||
| Other underwriting and general expenses | 22,854 | 16,673 | 18,699 | |||||||||
| Total expenses | 173,798 | 167,134 | 157,630 | |||||||||
| Income before income taxes | 38,572 | 22,006 | 6,117 | |||||||||
| Income taxes | 7,328 | 6,394 | 1,479 | |||||||||
| Net income | 31,244 | 15,612 | 4,638 | |||||||||
| Net income (loss) attributable to non-controlling interest | 163 | (379 | ) | 87 | ||||||||
| Net income attributable to NI Holdings, Inc. | $ | 31,081 | $ | 15,991 | $ | 4,551 | ||||||
| Basic earnings per common share | $ | 1.39 | $ | 0.71 | ||||||||
| Diluted earnings per common share | $ | 1.39 | $ | 0.71 | ||||||||
The accompanying notes are an integral part of these consolidated financial statements.
64
NI Holdings, Inc.
Consolidated Statements of Comprehensive Income
Years Ended December 31, 2018, 2017 and 2016
(dollar amounts in thousands)
| 2018 | ||||||||||||
Attributable to NI Holdings, Inc. | Attributable to Non-Controlling | Total | ||||||||||
| Net income | $ | 31,081 | $ | 163 | $ | 31,244 | ||||||
| Other comprehensive loss, before income taxes: | ||||||||||||
| Holding losses on investments | (8,206 | ) | (99 | ) | (8,305 | ) | ||||||
| Reclassification adjustment for net realized capital (gain) included in net income | (3,974 | ) | — | (3,974 | ) | |||||||
| Other comprehensive loss, before income taxes | (12,180 | ) | (99 | ) | (12,279 | ) | ||||||
| Income tax benefit related to items of other comprehensive income | 2,558 | 21 | 2,579 | |||||||||
| Other comprehensive loss, net of income taxes | (9,622 | ) | (78 | ) | (9,700 | ) | ||||||
| Comprehensive income | $ | 21,459 | $ | 85 | $ | 21,544 | ||||||
| 2017 | ||||||||||||
Attributable to NI Holdings, Inc. | Attributable to Non-Controlling Interest | Total | ||||||||||
| Net income (loss) | $ | 15,991 | $ | (379 | ) | $ | 15,612 | |||||
| Other comprehensive income, before income taxes: | ||||||||||||
| Holding gains on investments | 7,623 | 6 | 7,629 | |||||||||
| Reclassification adjustment for net realized capital loss (gain) included in net income | (3,046 | ) | 49 | (2,997 | ) | |||||||
| Other comprehensive income, before income taxes | 4,577 | 55 | 4,632 | |||||||||
| Income tax (expense) related to items of other comprehensive income | (1,601 | ) | (20 | ) | (1,621 | ) | ||||||
| Other comprehensive income, net of income taxes | 2,976 | 35 | 3,011 | |||||||||
| Comprehensive income (loss) | $ | 18,967 | $ | (344 | ) | $ | 18,623 | |||||
| 2016 | ||||||||||||
Attributable to NI Holdings, Inc. | Attributable to Non-Controlling | Total | ||||||||||
| Net income | $ | 4,551 | $ | 87 | $ | 4,638 | ||||||
| Other comprehensive income (loss), before income taxes: | ||||||||||||
| Holding gains on investments | 3,862 | 68 | 3,930 | |||||||||
| Reclassification adjustment for net realized capital loss (gain) included in net income | (5,691 | ) | 10 | (5,681 | ) | |||||||
| Other comprehensive income (loss), before income taxes | (1,829 | ) | 78 | (1,751 | ) | |||||||
| Income tax benefit (expense) related to items of other comprehensive income | 640 | (27 | ) | 613 | ||||||||
| Other comprehensive income (loss), net of income taxes | (1,189 | ) | 51 | (1,138 | ) | |||||||
| Comprehensive income | $ | 3,362 | $ | 138 | $ | 3,500 | ||||||
The accompanying notes are an integral part of these consolidated financial statements.
65
NI Holdings, Inc.
Consolidated Statements of Changes in Equity
Years Ended December 31, 2018, 2017 and 2016
(dollar amounts in thousands)
| Common Stock | Additional Paid-in Capital | Unearned Employee Stock Ownership Plan Shares | Retained Earnings | Accumulated Other Comprehensive Income, Net of Income Taxes |
Treasury Stock | Non- Controlling Interest | Total Equity | |||||||||||||||||||||||||
| Balance, January 1, 2016 | $ | — | $ | — | $ | — | $ | 135,040 | $ | 11,494 | $ | — | $ | 3,384 | $ | 149,918 | ||||||||||||||||
| Net income | — | — | — | 4,551 | — | — | 87 | 4,638 | ||||||||||||||||||||||||
| Other comprehensive income (loss), net of income taxes | — | — | — | — | (1,189 | ) | — | 51 | (1,138 | ) | ||||||||||||||||||||||
| Balance, December 31, 2016 | $ | — | $ | — | $ | — | $ | 139,591 | $ | 10,305 | $ | — | $ | 3,522 | $ | 153,418 | ||||||||||||||||
| Issuance of common stock | 230 | 92,915 | (2,400 | ) | — | — | — | — | 90,745 | |||||||||||||||||||||||
| Net income (loss) | — | — | — | 15,991 | — | — | (379 | ) | 15,612 | |||||||||||||||||||||||
| Other comprehensive income, net of income taxes | — | — | — | — | 2,976 | — | 35 | 3,011 | ||||||||||||||||||||||||
| Reclassification of income tax effects stranded in AOCI from tax reform | — | — | — | (2,717 | ) | 2,717 | — | — | — | |||||||||||||||||||||||
| Share-based compensation | — | 423 | — | — | — | — | — | 423 | ||||||||||||||||||||||||
| Purchase of treasury stock | — | — | — | — | — | (8,037 | ) | — | (8,037 | ) | ||||||||||||||||||||||
| Distribution of employee stock ownership plan shares | — | 158 | 243 | — | — | — | — | 401 | ||||||||||||||||||||||||
| Balance, December 31, 2017 | $ | 230 | $ | 93,496 | $ | (2,157 | ) | $ | 152,865 | $ | 15,998 | $ | (8,037 | ) | $ | 3,178 | $ | 255,573 | ||||||||||||||
| Net income | — | — | — | 31,081 | — | — | 163 | 31,244 | ||||||||||||||||||||||||
| Other comprehensive loss, net of income taxes | — | — | — | — | (9,622 | ) | — | (78 | ) | (9,700 | ) | |||||||||||||||||||||
| Share-based compensation | — | 1,232 | — | — | — | — | — | 1,232 | ||||||||||||||||||||||||
| Purchase of treasury stock | — | — | — | — | — | (2,996 | ) | — | (2,996 | ) | ||||||||||||||||||||||
| Issuance of vested award shares | — | (399 | ) | — | — | — | 399 | — | — | |||||||||||||||||||||||
| Distribution of employee stock ownership plan shares | — | 157 | 243 | — | — | — | — | 400 | ||||||||||||||||||||||||
| Balance, December 31, 2018 | $ | 230 | $ | 94,486 | $ | (1,914 | ) | $ | 183,946 | $ | 6,376 | $ | (10,634 | ) | 3,263 | $ | 275,753 | |||||||||||||||
The accompanying notes are an integral part of these consolidated financial statements.
66
NI Holdings, Inc.
Consolidated Statements of Cash Flows
Years Ended December 31, 2018, 2017 and 2016
(dollar amounts in thousands)
| 2018 | 2017 | 2016 | ||||||||||
| Cash flows from operating activities: | ||||||||||||
| Net income | $ | 31,244 | $ | 15,612 | $ | 4,638 | ||||||
| Adjustments to reconcile net income to net cash provided by operating activities: | ||||||||||||
| Gain on acquisition of Direct Auto Insurance Company | (4,578 | ) | — | — | ||||||||
| Net realized capital gain on investments | (3,974 | ) | (2,997 | ) | (5,681 | ) | ||||||
| Deferred income tax expense | (692 | ) | (2,067 | ) | (82 | ) | ||||||
| Depreciation of property and equipment | 492 | 500 | 441 | |||||||||
| Amortization of intangibles | 3,507 | 43 | 57 | |||||||||
| Distribution of employee stock ownership plan shares | 400 | 401 | — | |||||||||
| Share-based incentive compensation | 1,232 | 423 | — | |||||||||
| Amortization of deferred policy acquisition costs | 31,856 | 27,750 | 20,423 | |||||||||
| Deferral of policy acquisition costs | (35,863 | ) | (27,667 | ) | (20,921 | ) | ||||||
| Net amortization of premiums and discounts on investments | 1,149 | 1,368 | 894 | |||||||||
| Gain on sale of property and equipment | (11 | ) | — | — | ||||||||
| Changes in assets and liabilities which provided (used) cash: | ||||||||||||
| Premiums and agents’ balances receivable | (2,806 | ) | (3,646 | ) | (1,947 | ) | ||||||
| Reinsurance premiums payable | (428 | ) | 389 | (498 | ) | |||||||
| Reinsurance recoverables on losses | 1,896 | 3,064 | (1,921 | ) | ||||||||
| Accrued investment income | 161 | (565 | ) | (67 | ) | |||||||
| Receivable from Federal Crop Insurance Corporation | (5,668 | ) | 6,260 | (2,759 | ) | |||||||
| Federal income tax recoverable / payable | (2,280 | ) | 3,924 | (2,051 | ) | |||||||
| Other assets | (1,477 | ) | 506 | (902 | ) | |||||||
| Unpaid losses and loss adjustment expenses | 264 | (13,742 | ) | 14,290 | ||||||||
| Unearned premiums | 5,550 | 5,817 | 3,958 | |||||||||
| Accrued expenses and other liabilities | 981 | 3,052 | (565 | ) | ||||||||
| Net cash provided by operating activities | 20,955 | 18,425 | 7,307 | |||||||||
| Cash flows from investing activities: | ||||||||||||
| Proceeds from sales of fixed income securities | 61,465 | 24,584 | 21,692 | |||||||||
| Proceeds from sales of equity securities | 23,409 | 11,125 | 9,084 | |||||||||
| Purchases of fixed income securities | (73,871 | ) | (100,896 | ) | (31,188 | ) | ||||||
| Purchases of equity securities | (13,557 | ) | (25,419 | ) | (2,624 | ) | ||||||
| Purchases of property and equipment, net | (1,552 | ) | (1,334 | ) | (548 | ) | ||||||
| Acquisition of Direct Auto Insurance Company (cash consideration paid net of cash and cash equivalents acquired) | 27,485 | — | — | |||||||||
| Other | 18 | 83 | 74 | |||||||||
| Net cash provided by (used in) investing activities | 23,397 | (91,857 | ) | (3,510 | ) | |||||||
| Cash flows from financing activities: | ||||||||||||
| Proceeds from issuance of common stock | — | 93,145 | — | |||||||||
| Purchases of treasury stock | (2,996 | ) | (8,037 | ) | — | |||||||
| Loan to employee stock ownership plan | — | (2,400 | ) | — | ||||||||
| Net cash (used in) provided by financing activities | (2,996 | ) | 82,708 | — | ||||||||
| Net increase in cash and cash equivalents | 41,356 | 9,276 | 3,797 | |||||||||
| Cash and cash equivalents at beginning of period | 27,594 | 18,318 | 14,521 | |||||||||
| Cash and cash equivalents at end of period | $ | 68,950 | $ | 27,594 | $ | 18,318 | ||||||
The Company paid $10,300, $4,550, and $3,800 in federal income taxes during 2018, 2017, and 2016, respectively.
The accompanying notes are an integral part of these consolidated financial statements.
67
NI
Holdings, Inc.
Notes to Consolidated Financial Statements
December 31, 2018, 2017 and 2016
(dollar amounts in thousands)
1. Organization
NI Holdings, Inc. (“NI Holdings”) is a North Dakota business corporation that is the stock holding company of Nodak Insurance Company and became such in connection with the conversion of Nodak Mutual Insurance Company from a mutual to stock form of organization and the creation of a mutual holding company. The conversion was consummated on March 13, 2017. Immediately following the conversion, all of the outstanding shares of common stock of Nodak Insurance Company (the successor to Nodak Mutual Insurance Company) were issued to Nodak Mutual Group, Inc., which then contributed the shares to NI Holdings in exchange for 55% of the outstanding shares of common stock of NI Holdings. Nodak Insurance Company then became a wholly-owned stock subsidiary of NI Holdings. Prior to completion of the conversion, NI Holdings conducted no business and had no assets or liabilities. As a result of the conversion, NI Holdings became the holding company for Nodak Insurance Company and its existing subsidiaries. The newly issued shares of NI Holdings were available for public trading on March 16, 2017.
These consolidated financial statements of NI Holdings include the financial position and results of operations of NI Holdings and six other entities:
| · | Nodak Insurance Company (“Nodak Insurance”, formerly Nodak Mutual Insurance Company prior to the conversion); |
| · | Nodak Agency, Inc. (“Nodak Agency”); |
| · | American West Insurance Company (“American West”); |
| · | Primero Insurance Company (“Primero”); |
| · | Battle Creek Mutual Insurance Company (“Battle Creek”, an affiliated company with Nodak Insurance); and |
| · | Direct Auto Insurance Company (“Direct Auto”). |
Nodak Insurance is the largest domestic property and casualty insurance company in North Dakota. Nodak Insurance was incorporated on April 15, 1946 under the laws of North Dakota, and benefits from a strong marketing affiliation with the North Dakota Farm Bureau Federation (“NDFB”). Nodak Insurance specializes in providing private passenger auto, homeowners, farmowners, commercial, crop hail, and Federal multi-peril crop insurance coverages.
Nodak Agency, a wholly-owned subsidiary of Nodak Insurance, is an inactive shell corporation.
American West, a wholly-owned subsidiary of Nodak Insurance, is a property and casualty insurance company licensed in eight states in the Midwest and Western regions of the United States. American West began writing policies in 2002, and primarily writes personal auto, homeowners, and farm coverages in South Dakota. American West also writes personal auto coverage in North Dakota, as well as crop hail and Federal multi-peril crop insurance coverages in Minnesota and South Dakota.
Primero is a wholly-owned subsidiary of Tri-State, Ltd. Tri-State, Ltd. is an inactive shell corporation 100% owned by Nodak Insurance. Primero is a property and casualty insurance company writing non-standard automobile coverage in the states of Nevada, Arizona, North Dakota and South Dakota.
Battle Creek is controlled by Nodak Insurance via a surplus note and 100% quota-share agreement. The terms of the surplus note and quota-share agreement allow Nodak Insurance to appoint two-thirds of the Battle Creek Board of Directors. Battle Creek is a property and casualty insurance company writing personal auto, homeowners, and farm coverages solely in the state of Nebraska.
Direct Auto, a wholly-owned subsidiary of NI Holdings, is a property and casualty company licensed in Illinois. Direct Auto began writing non-standard automobile coverage in 2007, and was acquired by NI Holdings on August 31, 2018 via a stock purchase agreement. See Note 4.
The same executive management team provides oversight and strategic direction for the entire organization. Nodak Insurance provides common product oversight, pricing practices, and underwriting standards, as well as underwriting and claims administration, to itself, American West, and Battle Creek. Primero and Direct Auto personnel manage the day-to-day operations of their respective companies. The insurance companies share a combined business plan to achieve market penetration and underwriting profitability objectives. Distinctions within the products of the insurance companies generally relate to the states in which the risk is located and specific risk profiles targeted within similar classes of business.
68
2. Basis of Consolidation
Our consolidated financial statements, which we have prepared in accordance with accounting principles generally accepted in the United States of America (“GAAP”), include our accounts and those of our wholly-owned subsidiaries, as well as Battle Creek, an entity we control via contract. We have eliminated all significant inter-company accounts and transactions in consolidation. The terms “we”, “us”, “our”, or “the Company” as used herein refer to the consolidated entity.
3. Summary of Significant Accounting Policies
Use of Estimates:
In preparing our consolidated financial statements, management makes estimates and assumptions that affect the reported amounts of assets and liabilities at the date of the balance sheet, and revenues and expenses for the periods then ended. Actual results could differ significantly from those estimates.
We make estimates and assumptions that can have a significant effect on amounts and disclosures we report in our consolidated financial statements. The most significant estimates relate to our reserves for unpaid losses and loss adjustment expenses, earned premiums for crop insurance, valuation of investments, determination of other-than-temporary impairments, valuation allowances for deferred income tax assets, deferred policy acquisition costs, and the valuations used to establish intangible assets acquired related to business combinations. While we believe our estimates are appropriate, the ultimate amounts may differ from the estimates provided. We regularly review our methods for making these estimates as well as the continuing appropriateness of the estimated amounts, and we reflect any adjustment we consider necessary in our current results of operations.
Variable-Interest Entities:
Any company deemed to be a variable interest entity (“VIE”) is required to be consolidated by the primary beneficiary of the VIE.
We assess our investments in other entities at inception to determine if any meet the qualifications of a VIE. We consider an investment in another company to be a VIE if: (a) the total equity investment at risk is not sufficient to permit the entity to finance its activities without additional subordinated financial support, (b) the characteristics of a controlling financial interest are missing (either the ability to make decisions through voting or other rights, the obligation to absorb expected losses of the entity or the right to receive the expected residual returns of the entity), or (c) the voting rights of the equity holders are not proportional to their obligations to absorb the expected losses of the entity and/or the rights to receive the expected residual returns of the entity, and substantially all of the entity’s activities either involve or are conducted on behalf of an investor that has disproportionately few voting rights. Upon the occurrence of certain events, we would reassess our initial determination of whether the investment is a VIE.
We evaluate whether we are the primary beneficiary of each VIE and we consolidate the VIE if we have both (1) the power to direct the economically significant activities of the entity and (2) the obligation to absorb losses of, or the right to receive benefits from, the entity. We consider the contractual agreements that define the ownership structure, distribution of profits and losses, risks, responsibilities, indebtedness, voting rights, and board representation of the respective parties in determining whether we qualify as the primary beneficiary. Our assessment of whether we are the primary beneficiary of a VIE is performed at least annually.
We control Battle Creek via a 100% quota-share reinsurance agreement between Nodak Insurance and Battle Creek, as well as the ability to control a majority of the Board of Directors of Battle Creek. Through the effects of the 100% quota-share agreement with Battle Creek, we are considered the primary beneficiary of Battle Creek’s operating results excluding net investment income, bad debt expense, and income taxes. Therefore, we consolidate the financial statements of Battle Creek, and Battle Creek’s policyholders’ interest in Battle Creek is reflected as a non-controlling interest in Equity in our Consolidated Balance Sheet.
Cash and Cash Equivalents:
Cash and cash equivalents include certain investments in highly liquid debt instruments with original maturities of three months or less. Cost approximates fair value for these short-term investments.
Investments:
We have categorized our investment portfolio as “available-for-sale” and have reported the portfolio at fair value, with unrealized gains and losses, net of income taxes, reported in accumulated other comprehensive income. Fair values are based on quoted market prices or dealer quotes, if available. If a quoted market price is not available, fair value is estimated using quoted market prices for similar securities. Amortization of premium and accretion of discount are computed using an effective interest
69
method. Realized gains and losses are determined using the specific identification method and included in the determination of net income. Net investment income includes interest and dividend income together with amortization of purchase premiums and discounts, and is net of investment management and custody fees.
We review our investments each quarter to determine whether a decline in fair value below the amortized cost basis is other than temporary. Accordingly, we assess whether we intend to sell or it is more likely than not that we will be required to sell a security before recovery of its amortized cost basis. For fixed income securities that are considered other-than-temporarily impaired and that we do not intend to sell and will not be required to sell prior to recovery of the amortized cost basis, we separate the amount of the impairment into the amount that is credit related (credit loss component) and the amount due to all other factors. The credit loss component is recognized in earnings and is the difference between the security’s amortized cost basis and the present value of its expected future cash flows discounted at the security’s effective yield. The remaining difference between the security’s fair value and the present value of future expected cash flows is due to factors that are not credit related and, therefore, is not required to be recognized as losses in the Consolidated Statement of Operations, but is recognized in other comprehensive income.
We classify each fair value measurement at the appropriate level in the fair value hierarchy. The hierarchy gives the highest priority to unadjusted quoted market price in active markets for identical assets or liabilities (Level I measurements) and the lowest priority to unobservable inputs (Level III measurements). An asset’s or liability’s classification within the fair value hierarchy is based on the lowest level of significant input to its valuation.
Level I – Quoted price in active markets for identical assets and liabilities.
Level II – Quoted prices in markets that are not active or inputs that are observable either directly or indirectly. Level II inputs include quoted prices for similar assets or liabilities other than quoted in prices in Level I, quoted prices in markets that are not active, or other inputs that are observable or can be derived principally from or corroborated by observable market data for substantially the full term of the assets or liabilities.
Level III – Unobservable inputs that are supported by little or no market activity and are significant to the fair value of the assets or liabilities. Unobservable inputs reflect the reporting entity’s own assumptions that market participants would use in pricing the asset or liability. Level III assets and liabilities include financial instruments whose values are determined using pricing models, discounted cash flow methodologies, or similar techniques, as well as instruments for which the determination of fair value requires significant management judgment or estimation.
Fair Value of Other Financial Instruments:
Our other financial instruments, aside from investments, are cash and cash equivalents, premiums and agents’ balances receivable, and accrued expenses and accounts payable. The carrying amounts for cash and cash equivalents, premiums and agents’ balances receivable, and accrued expenses and accounts payable approximate their fair value based on their short-term nature. Other invested assets that do not have observable inputs and little or no market activity are carried on a cost basis. All other invested assets have been assessed for impairment. The carrying value of these other invested assets was $1,954 at December 31, 2018 and $1,972 at December 31, 2017.
Reclassifications:
Certain amounts in the 2017 consolidated financial statements have been reclassified to conform to the 2018 presentation.
Revenue Recognition:
We record premiums written at policy inception and recognize them as revenue on a pro rata basis over the policy term or, in the case of crop insurance, over the period of risk. The portion of premiums that could be earned in the future is deferred and reported as unearned premiums. When policies lapse, the Company reverses the unearned portion of the written premium and removes the applicable unearned premium. Policy-related fee income is recognized when collected.
The Company uses the direct write-off method for recognizing bad debts. Accounts are deemed to be delinquent after 60 days except for those accounts associated with amounts due from insureds for premiums, in which case policy cancellation procedures are commenced in accordance with state insurance regulations. Any earned but uncollected premiums are written off immediately upon the effective date of policy cancellation.
Policy Acquisition Costs:
We defer our policy acquisition costs, consisting primarily of commissions, premium taxes, and certain other underwriting costs, reduced by ceding commissions, which vary with and relate directly to the production of business. We amortize these deferred policy acquisition costs over the period in which we earn the premiums. The method we follow in computing deferred
70
policy acquisition costs limits the amount of such deferred costs to their estimated realizable value, which gives effect to the premium to be earned, related investment income, losses and loss adjustment expenses, and certain other costs we expect to incur as we earn the premium.
Property and Equipment:
We report property and equipment at cost less accumulated depreciation. Depreciation is computed using the straight-line method based upon estimated useful lives of the assets.
Losses and Loss Adjustment Expenses:
Liabilities for unpaid losses and loss adjustment expenses are estimates at a given point in time of the amounts we expect to pay with respect to policyholder claims based on facts and circumstances then known. At the time of establishing our estimates, we recognize that our ultimate liability for losses and loss adjustment expenses will exceed or be less than such estimates. We base our estimates of liabilities for unpaid losses and loss adjustment expenses on assumptions as to future loss trends, expected claims severity, judicial theories of liability, and other factors. During the loss adjustment period, we may learn additional facts regarding certain claims, and, consequently, it often becomes necessary for us to refine and adjust our estimates of the liability. We reflect any adjustments to our liabilities for unpaid losses and loss adjustment expenses in our operating results in the period in which we determine the need for a change in the estimates.
We maintain liabilities for unpaid losses and loss adjustment expenses with respect to both reported and unreported claims. We establish these liabilities for the purpose of covering the ultimate costs of settling all losses, including investigation and litigation costs. We base the amount of our liability for reported losses primarily upon a case-by-case evaluation of the type of risk involved, knowledge of the circumstances surrounding each claim, and the insurance policy provisions relating to the type of loss our policyholder incurred. We determine the amount of our liability for unreported losses and loss adjustment expenses on the basis of historical information by line of insurance. Inflation is not explicitly selected in the loss reserve analysis. However, historical inflation is embedded in the estimated loss reserving function through analysis of costs and trends and reviews of historical reserving results. We closely monitor our liabilities and update them periodically using new information on reported claims and a variety of statistical techniques. We do not discount our liabilities for unpaid losses and loss adjustment expenses.
Reserve estimates can change over time because of unexpected changes in assumptions related to our external environment and, to a lesser extent, assumptions as to our internal operations. Assumptions related to our external environment include the absence of significant changes in tort law and the legal environment which may impact liability exposure, the trends in judicial interpretations of insurance coverage and policy provisions, and the rate of loss cost inflation. Internal assumptions include consistency in the recording of premium and loss statistics, consistency in the recording of claims, payment and case reserving methodologies, accurate measurement of the impact of rate changes and changes in policy provisions, consistency in the quality and characteristics of business written within a given line of business, and consistency in reinsurance coverage and collectability of reinsured losses, among other items. To the extent we determine that underlying factors impacting our assumptions have changed, we attempt to make appropriate adjustments for such changes in our reserves. Accordingly, our ultimate liability for unpaid losses and loss adjustment expenses will likely differ from the amount recorded.
Income Taxes:
With the exception of Battle Creek, which files a stand-alone federal income tax return, we currently file a consolidated federal income tax return. For the year ended December 31, 2016, the consolidated federal income tax return included Nodak Mutual Insurance Company and its wholly-owned subsidiaries. For the year ended December 31, 2017 and thereafter, the consolidated federal income tax return included and will include thereafter NI Holdings and its wholly-owned subsidiaries. Direct Auto became part of the consolidated federal income tax return as of its acquisition date.
The Company reports tax-related interest and penalties, if any, as part of income tax expense in the year such amounts are determinable.
We account for deferred income taxes using the asset and liability method. The objective of the asset and liability method is to establish deferred income tax assets and liabilities for the temporary differences between the financial reporting basis and the income tax basis of our assets and liabilities at enacted tax rates expected to be in effect when we realize or settle such amounts.
Accounting guidance requires that companies re-measure existing deferred income tax assets (including loss carryforwards) and liabilities when a change in tax rate occurs, and record an offset for the net amount of the change as a component of income tax expense from continuing operations in the period of enactment. The guidance also requires any change to a previously recorded valuation allowance as a result of re-measuring existing temporary differences and loss carryforwards to be reflected as a component of income tax expense from continuing operations.
71
The Company has elected to reclassify any tax effects stranded in accumulated other comprehensive income as a result of a change in income tax rates to retained earnings.
Credit Risk:
Our primary investment objective is to earn competitive returns by investing in a diversified portfolio of securities. Our portfolio of fixed income securities and, to a lesser extent, short-term investments, is subject to credit risk. We define this risk as the potential loss in fair value resulting from adverse changes in the borrower’s ability to repay the debt. We manage this risk by performing an analysis of prospective investments and through regular reviews of our portfolio by our investment staff and advisors. We also limit the amount of our total investment portfolio that we invest in any one security.
Property and liability insurance coverages are marketed through captive agents in North Dakota and through independent insurance agencies located throughout all other operating areas. All business, except for the majority of Direct Auto’s business, is billed directly to the policyholders.
We maintain cash balances primarily at one bank, which are insured by the Federal Deposit Insurance Corporation (“FDIC”) up to $250. During the normal course of business, balances are maintained above the FDIC insurance limit. The Company maintains short-term investment balances in investment grade money market accounts that are insured by the Securities Investor Protection Corporation (“SIPC”) up to $500. On occasion, balances for these accounts are maintained in excess of the SIPC insurance limit.
Reinsurance:
The Company limits the maximum net loss that can arise from large risks or risks in concentrated areas of exposure by reinsuring (ceding) certain levels of risks to other insurers or reinsurers, either on an automatic basis under general reinsurance contracts known as “treaties” or by negotiation on substantial individual risks. Ceded reinsurance is treated as the risk and liability of the assuming companies.
Reinsurance contracts do not relieve the Company from its obligations to policyholders. In the event that all or any of the reinsuring companies might be unable to meet their obligations under existing reinsurance agreements, the Company would be liable for such defaulted amounts.
Goodwill and Other Intangibles:
Goodwill represents the excess of the purchase price over the underlying fair value of acquired entities. When completing acquisitions, we seek also to identify separately identifiable intangible assets that we have acquired. We assess goodwill and other intangibles with an indefinite useful life for impairment annually. We also assess goodwill and other intangibles for impairment upon the occurrence of certain events. In making our assessment, we consider a number of factors including operating results, business plans, economic projections, anticipated future cash flows, and current market data. Inherent uncertainties exist with respect to these factors and to our judgment in applying them when we make our assessment. Impairment of goodwill and other intangibles could result from changes in economic and operating conditions in future periods. We did not record any impairments of goodwill or other intangibles during the years ended December 31, 2018 or 2017.
Goodwill arising from the acquisition of Primero in 2014 represents the excess of the purchase price over the fair value of the net assets acquired. The purchase price in excess of the fair value of net assets acquired was negotiated at arms-length with an unrelated party and was based upon the strategic decision by Company management to expand both the geographic footprint and product lines of the Company. The nature of the business acquired was such that there were limited intangibles not reflected in the net assets acquired. The purchase price was paid with a combination of cash and cancellation of obligations owed to the acquired company by the sellers. The goodwill that arose from this transaction is included in the basis of the net assets acquired and is not deductible for income tax purposes.
Intangibles arising from the acquisition of Direct Auto in 2018 represent the estimated fair values of certain intangibles, including a favorable lease contract, a state insurance license, the value of the Direct Auto trade name, and the value of business acquired (“VOBA”). The state insurance license asset has an indefinite life, while the favorable lease contract, Direct Auto trade name, and VOBA assets will be amortized over eighteen months, five years, and twelve months, respectively, from the August 31, 2018 valuation date.
4. Acquisition of Direct Auto Insurance Company
On August 31, 2018, the Company completed the acquisition of 100% of the common stock of Direct Auto from private shareholders and Direct Auto became a consolidated subsidiary of the Company. Direct Auto is a property and casualty insurance company specializing in non-standard automobile insurance in the state of Illinois. The Company realized a gain of $4,578 on the purchase of Direct Auto due to the use of applicable purchase accounting guidance (known as a “bargain purchase”).
72
Direct Auto will remain headquartered in Chicago, Illinois and the current president (who was also one of the principal shareholders) of Direct Auto will continue to manage the Direct Auto insurance operations along with the current staff and management team. The results of Direct Auto are included as part of the Company’s non-standard auto business segment following the closing date.
We account for business acquisitions in accordance with the acquisition method of accounting, which requires, among other things, that most assets acquired, liabilities assumed, and contingent consideration be recognized at their fair values as of the acquisition date, which is the closing date for the Direct Auto transaction. During the measurement period, adjustments to provisional purchase price allocations are recognized if new information is obtained about the facts and circumstances that existed as of the acquisition date that, if known, would have resulted in the recognition of those assets and liabilities as of that date. The measurement period ends as soon as it is determined that no more information is obtainable, but in no case shall the measurement period exceed one year from the acquisition date. The Company does not expect any adjustments during this period.
The acquired Direct Auto business contributed revenues of $14,178 and net income of $2,979 to the Company for the period from September 1, 2018 to December 31, 2018. The following unaudited pro forma summary presents consolidated information of the Company as if the business combination had occurred on January 1, 2017:
Pro forma Three Months Ended December 31, | Pro forma Year Ended December 31, | |||||||||||||||
| 2018 | 2017 | 2018 | 2017 | |||||||||||||
| Revenues | $ | 57,023 | $ | 59,273 | $ | 237,346 | $ | 226,997 | ||||||||
| Net income attributable to NI Holdings, Inc. | 14,900 | 13,946 | 26,929 | 21,678 | ||||||||||||
| Basic earnings per common share attributable to NI Holdings, Inc. | 0.67 | 0.62 | 1.20 | 0.96 | ||||||||||||
Other than the gain on bargain purchase, the Company did not have any material, nonrecurring pro forma adjustments directly attributable to the business combination to be included in the reported pro forma revenue and earnings.
These pro forma amounts have been calculated after applying the Company’s accounting policies and adjusting the results of Direct Auto’s operations to reflect the deferral and amortization of policy acquisition costs and the additional amortization that would have been charged assuming the fair value adjustments to intangibles had been applied from January 1, 2017, with the related income tax effects. The gain is recognized in the first quarter of 2017 instead of the third quarter of 2018 for these pro forma amounts.
In 2018, the Company incurred $118 of acquisition-related costs. These expenses are included in other underwriting and general expenses in the Company’s Consolidated Statements of Operations for the year ended December 31, 2018. These expenses are reflected in pro forma earnings for the year ended December 31, 2017 in the table above.
73
The Company paid $17,000 in cash consideration to the private shareholders of Direct Auto. The acquisition of Direct Auto did not include any contingent consideration. The following table summarizes the consideration transferred to acquire Direct Auto and the amounts of identified assets acquired and liabilities assumed at the acquisition date:
| Fair Value of Consideration: | ||||
| Total cash consideration transferred | $ | 17,000 | ||
| Recognized Amounts of Identifiable Assets Acquired and Liabilities Assumed: | ||||
| Identifiable net assets: | ||||
| Cash and cash equivalents | $ | 44,485 | ||
| Fixed income securities, at fair value | 11,414 | |||
| Equity securities, at fair value | 14,634 | |||
| Premiums and agents' balances receivable | 5,849 | |||
| Accrued investment income | 63 | |||
| Property and equipment | 31 | |||
| Favorable lease contract (included in goodwill and other intangibles) | 20 | |||
| License (included in goodwill and other intangibles) | 100 | |||
| Trade name (included in goodwill and other intangibles) | 248 | |||
| Value of business acquired (included in goodwill and other intangibles) | 5,134 | |||
| Other assets | 107 | |||
| Unpaid losses and loss adjustment expenses | (40,967 | ) | ||
| Unearned premiums | (15,955 | ) | ||
| Federal income tax payable | (1,486 | ) | ||
| Deferred income taxes, net | (1,442 | ) | ||
| Accrued expenses and other liabilities | (657 | ) | ||
| Total identifiable net assets | $ | 21,578 | ||
| Gain on bargain purchase | $ | 4,578 | ||
The fair value of the assets acquired includes premiums and agents’ balances receivable of $5,849. This is the gross amount due from policyholders and agents, none of which is anticipated to be uncollectible. The Company did not acquire any other material class of receivable as a result of the acquisition of Direct Auto.
We have completed our final analysis of the assets and liabilities acquired and assigned fair values to the acquired intangibles consisting of favorable lease contract, state insurance license, Direct Auto trade name, and VOBA of $20, $100, $248, and $5,134, respectively. The state insurance license has an indefinite life, while the other intangibles will be amortized over useful lives of up to five years.
The gain realized on bargain purchase of $4,578 from the Direct Auto acquisition is included in fee and other income in the Company’s Consolidated Statements of Operations for the year ended December 31, 2018.
5. Recent Accounting Pronouncements
As an emerging growth company, we have elected to use the extended transition period for complying with any new or revised financial accounting standards pursuant to Section 13(a) of the Exchange Act. The following discussion includes effective dates for both public business entities and emerging growth companies, as well as whether specific guidance may be adopted early.
Adopted
On July 1, 2017, the Company early adopted amended guidance from the Financial Accounting Standards Board (the “FASB”) on goodwill impairment testing. Under the amended guidance, the optional qualitative assessment (Step 0) and the first step of the quantitative assessment (Step 1) remain unchanged. Step 2 is eliminated. As a result, for annual impairment testing or in the event a test is required prior to the annual test, the Company will use Step 0 to determine if an impairment might exist and Step 1 to determine the amount of goodwill impairment. An impairment loss will be recognized for the amount by which the reporting unit’s carrying amount exceeds its fair value, not to exceed the carrying amount of goodwill in the reporting unit. This guidance is effective for annual and interim reporting periods beginning after December 15, 2019 for public business entities. For private companies and emerging growth companies, this guidance is also effective for annual and interim reporting periods beginning after December 15, 2021. Early adoption is permitted for all entities beginning in 2017. The Company early adopted this guidance during the year ended December 31, 2017 on a prospective basis as a change in accounting principle, therefore at the date of adoption there was no impact to the Company’s financial position or results of operations.
74
In March 2016, the FASB issued amended guidance to simplify several aspects of the accounting for share-based payment transactions, including the income tax consequences, classification of awards as either equity or liabilities, and classification on the Consolidated Statement of Cash Flows. All excess income tax benefits and income tax deficiencies should be recognized as income tax expense or benefit in the Consolidated Statement of Operations, instead of affecting additional paid-in-capital on the Consolidated Balance Sheet. These discrete income tax items should be classified along with other income tax cash flows as an operating activity on the Consolidated Statement of Cash Flows. In addition, cash paid by an employer when directly withholding shares for tax-withholding purposes should be classified as a financing activity. This guidance is effective for annual periods beginning after December 15, 2016 for public business entities. For private companies and emerging growth companies, this guidance is effective for annual periods beginning after December 15, 2017, and interim periods within annual periods beginning after December 15, 2018. Early adoption is permitted for all entities in any period. An entity that elects early adoption must adopt all amendments in the same period. Amendments requiring recognition of excess income tax benefits and income tax deficiencies in the Consolidated Statement of Operations should be applied prospectively. The Company early adopted this guidance on a prospective basis for the year ended December 31, 2017. At the date of adoption, there was an immaterial impact to the computation of diluted earnings per share, but no impact to the Company’s financial position or results of operations.
In February 2018, the FASB issued new guidance to provide companies the option to reclassify income tax effects that are stranded in accumulated other comprehensive income as a result of income tax reform to retained earnings. This guidance is effective for all entities for fiscal years beginning after December 15, 2018, and interim periods within those fiscal years. Early adoption is permitted for reporting periods for which financial statements have not yet been issued or made available for issuance. In the period of adoption, an entity would be able to choose whether to apply the amendments retrospectively or in the period of adoption. The Company elected to early adopt this guidance during the year ended December 31, 2017 on a prospective basis, resulting in a $2,717 reclassification of stranded income tax effects from accumulated other comprehensive income to retained earnings within the Equity section of the Consolidated Balance Sheet as of December 31, 2017. There was no impact to the Company’s financial position, results of operations, or cash flows.
Not Yet Adopted
In January 2016, the FASB issued amended guidance that generally requires entities to measure equity securities at fair value and recognize changes in fair value in their results of operations. The FASB issued other impairment, disclosure, and presentation improvements related to financial instruments within the guidance. This guidance is to be applied through a cumulative-effect adjustment to beginning retained earnings that results in no impact to the Company’s results of operations at the date of adoption. We will adopt this standard on its effective date of January 1, 2019 for emerging growth companies. The most significant anticipated impact relates to the change in accounting for equity securities, where $8,184 of after-tax unrealized net capital gains will be reclassified from accumulated other comprehensive income to retained earnings as of January 1, 2019. The after-tax change in accounting for equity securities will not likely affect the Company’s total equity; however, this amount of unrealized net capital gains reclassified at the transition date to retained earnings will never be recognized in net income. Going forward, the accounting used for equity securities will record the market fluctuations attributed to equity securities through our results of operations rather than as a component of Other Comprehensive Income, which will add a level of volatility to our net income.
In May 2014, the FASB issued guidance that establishes the manner in which an entity recognizes the amount of revenue to which it expects to be entitled for the transfer of promised goods or services to customers. While the guidance will replace most existing GAAP revenue recognition guidance, the scope of the guidance excludes insurance contracts. The Company has reviewed its sources of revenues, and has determined that no material revenues are derived from non-insurance contracts and thus subject to the new revenue recognition guidance. This guidance is effective for annual and interim reporting periods beginning after December 15, 2017 for public business entities. For private companies and emerging growth companies, this guidance is effective for annual reporting periods beginning after December 15, 2018 and interim periods within fiscal years beginning after December 15, 2019. Early adoption is permitted for all entities. We currently believe that this guidance will have no impact on our financial position, results of operations, or cash flows when we adopt this guidance for the year ended December 31, 2019.
In February 2016, the FASB issued new guidance that requires lessees to recognize leases, including operating leases, on the lessee’s Consolidated Balance Sheet, unless a lease is considered a short-term lease. The new guidance also requires entities to make new judgments to identify leases. In July 2018, the FASB issued additional guidance to allow an optional transition method. An entity may apply the new leases guidance at the beginning of the earliest period presented in the financial statements, or at the adoption date and recognize a cumulative-effect adjustment to the opening balance of retained earnings in the period of cumulative adoption. The new guidance, which replaces the current lease guidance, is effective for annual and interim reporting periods beginning after December 15, 2018 for public business entities. For private companies and emerging growth companies, this guidance is effective for annual reporting periods beginning after December 15, 2019 and interim periods within fiscal years beginning after December 15, 2020. Early adoption is permitted for all entities. We do not expect the adoption of this new guidance to have a significant impact on our financial position, results of operations, or cash flows.
75
In June 2016, the FASB issued a new standard that will require timelier recording of credit losses on loans and other financial instruments held by financial institutions and other organizations. The guidance will require the measurement of all expected credit losses for financial assets held at the reporting date based on historical experience, current conditions, and reasonable and supportable forecasts. Financial institutions and other organizations will now use forward-looking information to better form their credit loss estimates. Many of the loss estimation techniques applied today will still be permitted, although the inputs to those techniques will change to reflect the full amount of expected credit losses. Organizations will continue to use judgment to determine which loss estimation method is appropriate for their circumstances. Additionally, the guidance requires enhanced disclosures to help investors and other financial statement users better understand significant estimates and judgments used in estimating credit losses, as well as the credit quality and underwriting standards of an organization’s portfolio. These disclosures include qualitative and quantitative requirements that provide additional information about the amounts recorded in the financial statements. Finally, the guidance amends the accounting for credit losses on available-for-sale fixed income securities and purchased financial assets with credit deterioration. The guidance is effective for fiscal years, and interim periods within those fiscal years, beginning after December 15, 2019 for public business entities which are SEC filers. For private companies and emerging growth companies, this guidance is effective for annual reporting periods beginning after December 15, 2020 and interim periods within fiscal years beginning after December 15, 2021. Early adoption is permitted for all entities as of the fiscal years beginning after December 15, 2018, including interim periods within those fiscal years. We are evaluating the impact this new guidance will have on our financial position, results of operations, and cash flows.
In August 2016, the FASB issued amended guidance that addresses diversity in how certain cash receipts and cash payments are presented and classified in the Consolidated Statement of Cash Flows. The amendments provide clarity on the treatment of eight specifically defined types of cash inflows and outflows. For private companies and emerging growth companies, this guidance is effective for annual reporting periods beginning after December 15, 2018 and interim periods within fiscal years beginning after December 15, 2019 using a retrospective transition method to each period presented or prospectively if adoption of an issue is impracticable. The adoption of this amended guidance will have no effect on our financial position or results of operations. We do not expect this amended guidance to have a significant impact on our Consolidated Statement of Cash Flows.
In November 2016, the FASB issued amended guidance on the presentation of restricted cash in the Consolidated Statement of Cash Flows. Entities will be required to explain the changes during a reporting period in the total of cash, cash equivalents, and amounts generally described as restricted cash or restricted cash equivalents. For private companies and emerging growth companies, this guidance is effective for annual reporting periods beginning after December 15, 2018 and interim periods within fiscal years beginning after December 15, 2019. Early adoption is permitted for all entities, including adoption in an interim period. If an entity early adopts the amendments in an interim period, any adjustments should be reflected as of the beginning of the fiscal year that includes that interim period. The amendments are to be applied using a retrospective transition method to each period presented. The adoption of this amended guidance will no effect on our financial position or results of operations. We do not expect this amended guidance to have a significant impact on our Consolidated Statement of Cash Flows.
In March 2017, the FASB issued amended guidance to shorten the amortization period of premiums on certain purchased callable fixed income securities to the earliest call date. The amended guidance is effective for fiscal years beginning after December 15, 2018, including interim periods within those fiscal years. For private companies and emerging growth companies, this amended guidance is effective for fiscal years beginning after December 15, 2019, and interim periods within fiscal years beginning after December 15, 2020. Early adoption is permitted, including adoption in an interim period. If an entity early adopts the amendments in an interim period, any adjustments should be reflected as of the beginning of the fiscal year that includes that interim period. An entity should apply the amendments on a modified retrospective basis through a cumulative-effect adjustment directly to retained earnings as of the beginning of the period of adoption. We are evaluating the requirements of this guidance and the potential impact to our financial position, results of operations, and cash flows.
In August 2018, the FASB issued modified disclosure requirements relating to the fair value of assets and liabilities. The amended requirements are effective for fiscal years, and interim periods within those fiscal years, beginning after December 15, 2019. Early adoption is permitted. We do not expect these modified requirements will have a material impact on our financial disclosures.
76
6. Investments
The amortized cost and estimated fair value of investment securities as of December 31, 2018 and 2017 were as follows:
| December 31, 2018 | ||||||||||||||||
| Cost or Amortized Cost | Gross Unrealized Gains | Gross Unrealized Losses | Fair Value | |||||||||||||
| Fixed income securities: | ||||||||||||||||
| U.S. Government and agencies | $ | 19,183 | $ | 158 | $ | (133 | ) | $ | 19,208 | |||||||
| Obligations of states and political subdivisions | 52,782 | 475 | (559 | ) | 52,698 | |||||||||||
| Corporate securities | 95,290 | 265 | (1,413 | ) | 94,142 | |||||||||||
| Residential mortgage-backed securities | 50,902 | 110 | (729 | ) | 50,283 | |||||||||||
| Commercial mortgage-backed securities | 19,520 | 65 | (270 | ) | 19,315 | |||||||||||
| Asset-backed securities | 19,617 | 4 | (298 | ) | 19,323 | |||||||||||
| Total fixed income securities | 257,294 | 1,077 | (3,402 | ) | 254,969 | |||||||||||
| Equity securities: | ||||||||||||||||
| Basic materials | 1,527 | — | (187 | ) | 1,340 | |||||||||||
| Communications | 4,076 | 1,296 | (424 | ) | 4,948 | |||||||||||
| Consumer, cyclical | 5,128 | 2,650 | (167 | ) | 7,611 | |||||||||||
| Consumer, non-cyclical | 9,356 | 3,929 | (916 | ) | 12,369 | |||||||||||
| Energy | 1,622 | 8 | (289 | ) | 1,341 | |||||||||||
| Financial | 4,856 | 121 | (549 | ) | 4,428 | |||||||||||
| Industrial | 4,537 | 2,529 | (368 | ) | 6,698 | |||||||||||
| Technology | 7,037 | 3,647 | (921 | ) | 9,763 | |||||||||||
| Total equity securities | 38,139 | 14,180 | (3,821 | ) | 48,498 | |||||||||||
| Total investments | $ | 295,433 | $ | 15,257 | $ | (7,223 | ) | $ | 303,467 | |||||||
| December 31, 2017 | ||||||||||||||||
| Cost or Amortized Cost | Gross Unrealized Gains | Gross Unrealized Losses | Fair Value | |||||||||||||
| Fixed income securities: | ||||||||||||||||
| U.S. Government and agencies | $ | 9,531 | $ | 175 | $ | (57 | ) | $ | 9,649 | |||||||
| Obligations of states and political subdivisions | 81,741 | 1,171 | (317 | ) | 82,595 | |||||||||||
| Corporate securities | 88,474 | 1,197 | (220 | ) | 89,451 | |||||||||||
| Residential mortgage-backed securities | 28,557 | 124 | (157 | ) | 28,524 | |||||||||||
| Commercial mortgage-backed securities | 11,228 | 61 | (119 | ) | 11,170 | |||||||||||
| Asset-backed securities | 15,447 | 10 | (88 | ) | 15,369 | |||||||||||
| Total fixed income securities | 234,978 | 2,738 | (958 | ) | 236,758 | |||||||||||
| Equity securities: | ||||||||||||||||
| Basic materials | 768 | 124 | — | 892 | ||||||||||||
| Communications | 3,027 | 1,449 | (154 | ) | 4,322 | |||||||||||
| Consumer, cyclical | 5,303 | 4,156 | (120 | ) | 9,339 | |||||||||||
| Consumer, non-cyclical | 7,090 | 3,940 | (125 | ) | 10,905 | |||||||||||
| Energy | 2,003 | 272 | (44 | ) | 2,231 | |||||||||||
| Financial | 2,007 | 410 | — | 2,417 | ||||||||||||
| Industrial | 5,038 | 4,167 | — | 9,205 | ||||||||||||
| Technology | 3,792 | 4,668 | (210 | ) | 8,250 | |||||||||||
| Total equity securities | 29,028 | 19,186 | (653 | ) | 47,561 | |||||||||||
| Total investments | $ | 264,006 | $ | 21,924 | $ | (1,611 | ) | $ | 284,319 | |||||||
77
The amortized cost and estimated fair value of fixed income securities by contractual maturity are shown below. Actual maturities could differ from contractual maturities because issuers of the securities may have the right to call or prepay certain obligations, which may or may not include call or prepayment penalties.
| December 31, 2018 | ||||||||
| Amortized Cost | Fair Value | |||||||
| Due to mature: | ||||||||
| One year or less | $ | 12,490 | $ | 12,463 | ||||
| After one year through five years | 96,900 | 96,614 | ||||||
| After five years through ten years | 52,128 | 51,351 | ||||||
| After ten years | 5,737 | 5,620 | ||||||
| Mortgage / asset-backed securities | 90,039 | 88,921 | ||||||
| Total fixed income securities | $ | 257,294 | $ | 254,969 | ||||
| December 31, 2017 | ||||||||
| Amortized Cost | Fair Value | |||||||
| Due to mature: | ||||||||
| One year or less | $ | 12,761 | $ | 12,766 | ||||
| After one year through five years | 86,830 | 87,642 | ||||||
| After five years through ten years | 69,586 | 70,680 | ||||||
| After ten years | 10,569 | 10,607 | ||||||
| Mortgage / asset-backed securities | 55,232 | 55,063 | ||||||
| Total fixed income securities | $ | 234,978 | $ | 236,758 | ||||
Fixed income securities with a fair value of $4,900 at December 31, 2018 and $3,493 at December 31, 2017 were deposited with various state regulatory agencies as required by law. The increase was primarily due to the Direct Auto acquisition. The Company has not pledged any assets to secure any obligations.
78
The investment category and duration of the Company’s gross unrealized losses on fixed income securities and equity securities were as follows:
| December 31, 2018 | ||||||||||||||||||||||||
| Less than 12 Months | Greater than 12 months | Total | ||||||||||||||||||||||
| Fair Value | Unrealized Losses | Fair Value | Unrealized Losses | Fair Value | Unrealized Losses | |||||||||||||||||||
| Fixed income securities: | ||||||||||||||||||||||||
| U.S. Government and agencies | $ | 2,593 | $ | (3 | ) | $ | 7,523 | $ | (130 | ) | $ | 10,116 | $ | (133 | ) | |||||||||
| Obligations of states and political subdivisions | 8,467 | (119 | ) | 18,218 | (440 | ) | 26,685 | (559 | ) | |||||||||||||||
| Corporate securities | 24,793 | (266 | ) | 45,033 | (1,147 | ) | 69,826 | (1,413 | ) | |||||||||||||||
| Residential mortgage-backed securities | 10,325 | (62 | ) | 26,459 | (667 | ) | 36,784 | (729 | ) | |||||||||||||||
| Commercial mortgage-backed securities | 5,980 | (55 | ) | 7,117 | (215 | ) | 13,097 | (270 | ) | |||||||||||||||
| Asset-backed securities | 7,908 | (183 | ) | 10,276 | (115 | ) | 18,184 | (298 | ) | |||||||||||||||
| Total fixed income securities | 60,066 | (688 | ) | 114,626 | (2,714 | ) | 174,692 | (3,402 | ) | |||||||||||||||
| Equity securities: | ||||||||||||||||||||||||
| Basic materials | 1,340 | (187 | ) | — | — | 1,340 | (187 | ) | ||||||||||||||||
| Communications | 2,001 | (378 | ) | 167 | (46 | ) | 2,168 | (424 | ) | |||||||||||||||
| Consumer, cyclical | 1,237 | (167 | ) | — | — | 1,237 | (167 | ) | ||||||||||||||||
| Consumer, non-cyclical | 4,781 | (899 | ) | 316 | (17 | ) | 5,097 | (916 | ) | |||||||||||||||
| Energy | 1,041 | (289 | ) | — | — | 1,041 | (289 | ) | ||||||||||||||||
| Financial | 3,722 | (549 | ) | — | — | 3,722 | (549 | ) | ||||||||||||||||
| Industrial | 2,281 | (368 | ) | — | — | 2,281 | (368 | ) | ||||||||||||||||
| Technology | 3,212 | (833 | ) | 123 | (88 | ) | 3,335 | (921 | ) | |||||||||||||||
| Total equity securities | 19,615 | (3,670 | ) | 606 | (151 | ) | 20,221 | (3,821 | ) | |||||||||||||||
| Total investments | $ | 79,681 | $ | (4,358 | ) | $ | 115,232 | $ | (2,865 | ) | $ | 194,913 | $ | (7,223 | ) | |||||||||
| December 31, 2017 | ||||||||||||||||||||||||
| Less than 12 Months | Greater than 12 months | Total | ||||||||||||||||||||||
| Fair Value | Unrealized Losses | Fair Value | Unrealized Losses | Fair Value | Unrealized Losses | |||||||||||||||||||
| Fixed income securities: | ||||||||||||||||||||||||
| U.S. Government and agencies | $ | 6,442 | $ | (54 | ) | $ | 497 | $ | (3 | ) | $ | 6,939 | $ | (57 | ) | |||||||||
| Obligations of states and political subdivisions | 28,219 | (251 | ) | 3,593 | (66 | ) | 31,812 | (317 | ) | |||||||||||||||
| Corporate securities | 39,025 | (201 | ) | 1,195 | (19 | ) | 40,220 | (220 | ) | |||||||||||||||
| Residential mortgage-backed securities | 7,573 | (40 | ) | 7,248 | (117 | ) | 14,821 | (157 | ) | |||||||||||||||
| Commercial mortgage-backed securities | 4,652 | (64 | ) | 1,643 | (55 | ) | 6,295 | (119 | ) | |||||||||||||||
| Asset-backed securities | 13,386 | (80 | ) | 781 | (8 | ) | 14,167 | (88 | ) | |||||||||||||||
| Total fixed income securities | 99,297 | (690 | ) | 14,957 | (268 | ) | 114,254 | (958 | ) | |||||||||||||||
| Equity securities: | ||||||||||||||||||||||||
| Communications | 840 | (48 | ) | 107 | (106 | ) | 947 | (154 | ) | |||||||||||||||
| Consumer, cyclical | 898 | (116 | ) | 214 | (4 | ) | 1,112 | (120 | ) | |||||||||||||||
| Consumer, non-cyclical | 1,894 | (125 | ) | — | — | 1,894 | (125 | ) | ||||||||||||||||
| Energy | 243 | (44 | ) | — | — | 243 | (44 | ) | ||||||||||||||||
| Technology | 634 | (120 | ) | 152 | (90 | ) | 786 | (210 | ) | |||||||||||||||
| Total equity securities | 4,509 | (453 | ) | 473 | (200 | ) | 4,982 | (653 | ) | |||||||||||||||
| Total investments | $ | 103,806 | $ | (1,143 | ) | $ | 15,430 | $ | (468 | ) | $ | 119,236 | $ | (1,611 | ) | |||||||||
Investments with unrealized losses are categorized with a duration of greater than 12 months when all positions of a security have continually been in a loss position for at least 12 months.
79
We frequently review our investment portfolio for declines in fair value. Our process for identifying declines in the fair value of investments that are other than temporary involves consideration of several factors. These factors include (i) the time period in which there has been a significant decline in value, (ii) an analysis of the liquidity, business prospects, and overall financial condition of the issuer, (iii) the significance of the decline, and (iv) our intent and ability to hold the investment for a sufficient period of time for the value to recover. When our analysis of the above factors results in the conclusion that declines in fair values are other than temporary, the cost of the securities is written down to fair value and the previously unrealized loss is therefore reflected as a realized capital loss on investment.
The Company recorded impairments of $382 in the year ended December 31, 2018. The Company recorded impairments of $330 in the year ended December 31, 2017. The Company did not record any impairments in 2016.
As of December 31, 2018, we held 317 fixed income securities with unrealized losses. As of December 31, 2017, we held 196 fixed income securities with unrealized losses. In conjunction with our outside investment advisors, we analyzed the credit ratings of the securities as well as the historical monthly amortized cost to fair value ratio of securities in an unrealized loss position. This analysis yielded no fixed income securities that had fair values less than 80% of amortized cost for the preceding 12-month period.
Net investment income consisted of the following:
| Year Ended December 31, | ||||||||||||
| 2018 | 2017 | 2016 | ||||||||||
| Fixed income securities | $ | 6,975 | $ | 6,010 | $ | 4,709 | ||||||
| Equity securities | 934 | 650 | 376 | |||||||||
| Real estate | 364 | 352 | 311 | |||||||||
| Cash and cash equivalents | 111 | 57 | 64 | |||||||||
| Total gross investment income | 8,384 | 7,069 | 5,460 | |||||||||
| Investment expenses | 2,204 | 2,038 | 1,816 | |||||||||
| Net investment income | $ | 6,180 | $ | 5,031 | $ | 3,644 | ||||||
Net realized capital gain on investments consisted of the following:
| Year Ended December 31, | ||||||||||||
| 2018 | 2017 | 2016 | ||||||||||
| Gross realized gains | $ | 5,584 | $ | 3,615 | $ | 6,098 | ||||||
| Gross realized losses, excluding other-than-temporary impairment losses | (1,228 | ) | (288 | ) | (417 | ) | ||||||
| Other-than-temporary impairment losses | (382 | ) | (330 | ) | — | |||||||
| Net realized capital gain on investments | $ | 3,974 | $ | 2,997 | $ | 5,681 | ||||||
7. Fair Value Measurements
We maximize the use of observable inputs in our valuation techniques and apply unobservable inputs only to the extent that observable inputs are unavailable. The largest class of assets and liabilities carried at fair value by the Company at December 31, 2018 and 2017 were fixed income securities.
Prices provided by independent pricing services and independent broker quotes can vary widely, even for the same security.
Our available-for-sale investments are comprised of a variety of different securities, which are classified into levels based on the valuation technique and inputs used in their valuation. The valuation of cash equivalents and equity securities are generally based on Level I inputs, which use the market-approach valuation technique. The valuation of our fixed income securities generally incorporates significant Level II inputs using the market and income approach techniques. We may assign a lower level to inputs typically considered to be Level II based on our assessment of liquidity and relative level of uncertainty surrounding inputs. There were no assets or liabilities classified at Level III at December 31, 2018 or 2017.
80
The following tables set forth our assets that are measured on a recurring basis by the level within the fair value hierarchy in which fair value measurements fall:
| December 31, 2018 | ||||||||||||||||
| Total | Level I | Level II | Level III | |||||||||||||
| Fixed income securities: | ||||||||||||||||
| U.S. Government and agencies | $ | 19,208 | $ | — | $ | 19,208 | $ | — | ||||||||
| Obligations of states and political subdivisions | 52,698 | — | 52,698 | — | ||||||||||||
| Corporate securities | 94,142 | — | 94,142 | — | ||||||||||||
| Residential mortgage-backed securities | 50,283 | — | 50,283 | — | ||||||||||||
| Commercial mortgage-backed securities | 19,315 | — | 19,315 | — | ||||||||||||
| Asset-backed securities | 19,323 | — | 19,323 | — | ||||||||||||
| Total fixed income securities | 254,969 | — | 254,969 | — | ||||||||||||
| Equity securities: | ||||||||||||||||
| Basic materials | 1,340 | 1,340 | — | — | ||||||||||||
| Communications | 4,948 | 4,948 | — | — | ||||||||||||
| Consumer, cyclical | 7,611 | 7,611 | — | — | ||||||||||||
| Consumer, non-cyclical | 12,369 | 12,369 | — | — | ||||||||||||
| Energy | 1,341 | 1,341 | — | — | ||||||||||||
| Financial | 4,428 | 4,428 | — | — | ||||||||||||
| Industrial | 6,698 | 6,698 | — | — | ||||||||||||
| Technology | 9,763 | 9,763 | — | — | ||||||||||||
| Total equity securities | 48,498 | 48,498 | — | — | ||||||||||||
| Cash and cash equivalents | 68,950 | 68,950 | — | — | ||||||||||||
| Total assets at fair value | $ | 372,417 | $ | 117,448 | $ | 254,969 | $ | — | ||||||||
| December 31, 2017 | ||||||||||||||||
| Total | Level I | Level II | Level III | |||||||||||||
| Fixed income securities: | ||||||||||||||||
| U.S. Government and agencies | $ | 9,649 | $ | — | $ | 9,649 | $ | — | ||||||||
| Obligations of states and political subdivisions | 82,595 | — | 82,595 | — | ||||||||||||
| Corporate securities | 89,451 | — | 89,451 | — | ||||||||||||
| Residential mortgage-backed securities | 28,524 | — | 28,524 | — | ||||||||||||
| Commercial mortgage-backed securities | 11,170 | — | 11,170 | — | ||||||||||||
| Asset-backed securities | 15,369 | — | 15,369 | — | ||||||||||||
| Total fixed income securities | 236,758 | — | 236,758 | — | ||||||||||||
| Equity securities: | ||||||||||||||||
| Basic materials | 892 | 892 | — | — | ||||||||||||
| Communications | 4,322 | 4,322 | — | — | ||||||||||||
| Consumer, cyclical | 9,339 | 9,339 | — | — | ||||||||||||
| Consumer, non-cyclical | 10,905 | 10,905 | — | — | ||||||||||||
| Energy | 2,231 | 2,231 | — | — | ||||||||||||
| Financial | 2,417 | 2,417 | — | — | ||||||||||||
| Industrial | 9,205 | 9,205 | — | — | ||||||||||||
| Technology | 8,250 | 8,250 | — | — | ||||||||||||
| Total equity securities | 47,561 | 47,561 | — | — | ||||||||||||
| Cash and cash equivalents | 27,594 | 27,594 | — | — | ||||||||||||
| Total assets at fair value | $ | 311,913 | $ | 75,155 | $ | 236,758 | $ | — | ||||||||
There were no liabilities measured at fair value on a recurring basis at December 31, 2018 or 2017.
81
8. Reinsurance
The Company will assume and cede certain premiums and losses to and from various companies and associations under various reinsurance agreements. The Company seeks to limit the maximum net loss that can arise from large risks or risks in concentrated areas of exposure through use of these agreements, either on an automatic basis under general reinsurance contracts known as treaties or by negotiation on substantial individual risks.
Reinsurance contracts do not relieve the Company from its obligation to policyholders. Additionally, failure of reinsurers to honor their obligations could result in significant losses to us. There can be no assurance that reinsurance will continue to be available to us at the same extent, and at the same cost, as it has in the past. The Company may choose in the future to reevaluate the use of reinsurance to increase or decrease the amounts of risk ceded to reinsurers.
As a group, during the years ended December 31, 2018 and 2017, the Company retained the first $10,000 of weather-related losses from catastrophic events and had reinsurance under various reinsurance agreements up to $74,600 in excess of its $10,000 retained risk. For 2019, the catastrophe retention amount remains at $10,000 while the catastrophic reinsurance increased to $78,600. Prior to January 1, 2017, the group collectively retained the first $5,000 of weather-related losses.
The Company actively monitors and evaluates the financial condition of the reinsurers and develops estimates of the uncollectible amounts due from reinsurers. Such estimates are made based on periodic evaluation of balances due from reinsurers, judgments regarding reinsurers’ solvency, known disputes, reporting characteristics of the underlying reinsured business, historical experience, current economic conditions, and the state of reinsurer relations in general. Collection risk is mitigated from reinsurers by entering into reinsurance arrangements only with reinsurers that have strong credit ratings and statutory surplus above certain levels. The Company’s largest reinsurance recoverables on paid and unpaid losses were due from reinsurance companies with A.M. Best ratings of “A-” or higher, except for one reinsurer with a rating of “B++”, with a receiveable of $315 at December 31, 2018. This reinsurer was replaced during 2019, primarily due to the 2018 downgrade.
A reconciliation of direct to net premiums on both a written and an earned basis is as follows:
| 2018 | 2017 | 2016 | ||||||||||||||||||||||
| Premiums Written | Premiums Earned | Premiums Written | Premiums Earned | Premiums Written | Premiums Earned | |||||||||||||||||||
| Direct premium | $ | 225,223 | $ | 219,600 | $ | 195,238 | $ | 189,418 | $ | 180,870 | $ | 176,958 | ||||||||||||
| Assumed premium | 6,441 | 6,514 | 6,709 | 6,711 | 6,591 | 6,546 | ||||||||||||||||||
| Ceded premium | (30,394 | ) | (30,394 | ) | (16,665 | ) | (16,665 | ) | (30,748 | ) | (30,748 | ) | ||||||||||||
| Net premiums | $ | 201,270 | $ | 195,720 | $ | 185,282 | $ | 179,464 | $ | 156,713 | $ | 152,756 | ||||||||||||
| Percentage of assumed premium earned to net premium earned | 3.3% | 3.7% | 4.3% | |||||||||||||||||||||
A reconciliation of direct to net losses and loss adjustment expenses is as follows:
| 2018 | 2017 | 2016 | ||||||||||
| Direct losses and loss adjustment expenses | $ | 119,894 | $ | 124,117 | $ | 146,391 | ||||||
| Assumed losses and loss adjustment expenses | 3,399 | 6,177 | 4,947 | |||||||||
| Ceded losses and loss adjustment expenses | (4,205 | ) | (7,583 | ) | (32,830 | ) | ||||||
| Net losses and loss adjustment expenses | $ | 119,088 | $ | 122,711 | $ | 118,508 | ||||||
If 100% of our ceded reinsurance was cancelled as of December 31, 2018, no ceded commissions would need to be returned to the reinsurers. Reinsurance contracts are typically effective from January 1 through December 31 each year.
82
9. Deferred Policy Acquisition Costs
Activity with regards to our deferred policy acquisition costs was as follows:
| Year Ended December 31, | ||||||||||||
| 2018 | 2017 | 2016 | ||||||||||
| Balance, beginning of year | $ | 8,859 | $ | 8,942 | $ | 8,444 | ||||||
| Deferral of policy acquisition costs | 35,863 | 27,667 | 20,921 | |||||||||
| Amortization of deferred policy acquisition costs | (31,856 | ) | (27,750 | ) | (20,423 | ) | ||||||
| Balance, end of year | $ | 12,866 | $ | 8,859 | $ | 8,942 | ||||||
10. Unpaid Losses and Loss Adjustment Expenses
Activity in the liability for unpaid losses and loss adjustment expenses is summarized as follows:
| Year Ended December 31, | ||||||||||||
| 2018 | 2017 | 2016 | ||||||||||
| Balance at beginning of year: | ||||||||||||
| Liability for unpaid losses and loss adjustment expenses | $ | 45,890 | $ | 59,632 | $ | 45,342 | ||||||
| Reinsurance recoverables on losses | 4,128 | 7,192 | 5,109 | |||||||||
| Net balance at beginning of year | 41,762 | 52,440 | 40,233 | |||||||||
| Acquired unpaid losses and loss adjustment expenses related to: | ||||||||||||
| Current year | 17,795 | — | — | |||||||||
| Prior years | 23,172 | — | — | |||||||||
| Total acquired | 40,967 | — | — | |||||||||
| Incurred related to: | ||||||||||||
| Current year | 119,677 | 132,812 | 123,264 | |||||||||
| Prior years | (589 | ) | (10,101 | ) | (4,756 | ) | ||||||
| Total incurred | 119,088 | 122,711 | 118,508 | |||||||||
| Paid related to: | ||||||||||||
| Current year | 92,175 | 104,769 | 90,772 | |||||||||
| Prior years | 24,753 | 28,620 | 15,529 | |||||||||
| Total paid | 116,928 | 133,389 | 106,301 | |||||||||
| Balance at end of year: | ||||||||||||
| Liability for unpaid losses and loss adjustment expenses | 87,121 | 45,890 | 59,632 | |||||||||
| Reinsurance recoverables on losses | 2,232 | 4,128 | 7,192 | |||||||||
| Net balance at end of year | $ | 84,889 | $ | 41,762 | $ | 52,440 | ||||||
The prior years’ provision for unpaid losses and loss adjustment expenses decreased by $589, $10,101, and $4,756 during 2018, 2017, and 2016, respectively. Increases and decreases are generally the result of ongoing analysis of recent loss development trends. As additional information becomes known regarding individual claims, original estimates are increased or decreased accordingly.
83
The following tables present information, organized by our primary operating segments, about incurred and paid claims development as of December 31, 2018, net of reinsurance, as well as cumulative claim frequency and the total of IBNR reserves plus expected development on reported claims. The cumulative number of reported claims represents open claims, claims closed with payment, and claims closed without payment. It does not include an estimated amount for unreported claims. The number of claims is measured by claim event (such as a car accident or storm damage) and an individual claim event may result in more than one reported claim (such as a car accident with both property and liability damages). The Company considers a claim that does not result in a liability as a claim closed without payment. The tables include unaudited information about incurred and paid claims development for the years ended December 31, 2009 through 2015, and through 2017 for the Direct Auto information, which we present as supplementary information.
| Private Passenger Auto | Incurred Claims and Allocated Claim Adjustment Expenses, Net of Reinsurance For the Year Ended December 31, | At December 31, 2018 | ||||||||||||||||||||||||||||||||||||||||||||||
| (prior years unaudited) | ||||||||||||||||||||||||||||||||||||||||||||||||
| Accident Year | 2009 | 2010 | 2011 | 2012 | 2013 | 2014 | 2015 | 2016 | 2017 | 2018 | Total IBNR Plus Expected Development on Reported Claims | Cumulative Number of Reported Claims | ||||||||||||||||||||||||||||||||||||
| (in thousands, except claim counts) | ||||||||||||||||||||||||||||||||||||||||||||||||
| 2009 | $ | 29,397 | $ | 27,749 | $ | 26,460 | $ | 25,813 | $ | 26,137 | $ | 25,910 | $ | 25,420 | $ | 25,409 | $ | 25,273 | $ | 25,234 | $ | 1 | 11,370 | |||||||||||||||||||||||||
| 2010 | — | 26,090 | 23,801 | 23,102 | 23,325 | 23,265 | 23,271 | 23,249 | 23,123 | 23,120 | — | 11,538 | ||||||||||||||||||||||||||||||||||||
| 2011 | — | — | 25,552 | 24,126 | 25,220 | 24,409 | 24,209 | 23,967 | 23,814 | 23,826 | 29 | 11,544 | ||||||||||||||||||||||||||||||||||||
| 2012 | — | — | — | 26,962 | 24,787 | 24,323 | 24,098 | 24,133 | 23,298 | 23,621 | 130 | 9,916 | ||||||||||||||||||||||||||||||||||||
| 2013 | — | — | — | — | 29,079 | 27,840 | 27,363 | 27,334 | 26,014 | 26,138 | 145 | 10,823 | ||||||||||||||||||||||||||||||||||||
| 2014 | — | — | — | — | — | 32,548 | 31,349 | 30,427 | 29,099 | 29,144 | 317 | 11,738 | ||||||||||||||||||||||||||||||||||||
| 2015 | — | — | — | — | — | — | 32,438 | 31,532 | 30,461 | 30,503 | 305 | 11,682 | ||||||||||||||||||||||||||||||||||||
| 2016 | — | — | — | — | — | — | — | 40,227 | 39,260 | 39,057 | 507 | 14,302 | ||||||||||||||||||||||||||||||||||||
| 2017 | — | — | — | — | — | — | — | — | 40,779 | 40,199 | 916 | 13,695 | ||||||||||||||||||||||||||||||||||||
| 2018 | — | — | — | — | — | — | — | — | — | 44,925 | 2,346 | 13,568 | ||||||||||||||||||||||||||||||||||||
| Total | $ | 305,767 | ||||||||||||||||||||||||||||||||||||||||||||||
| Private Passenger Auto | Paid Claims and Allocated Claim Adjustment Expenses, Net of Reinsurance For the Year Ended December 31, | |||||||||||||||||||||||||||||||||||||||
| (prior years unaudited) | ||||||||||||||||||||||||||||||||||||||||
| Accident Year | 2009 | 2010 | 2011 | 2012 | 2013 | 2014 | 2015 | 2016 | 2017 | 2018 | ||||||||||||||||||||||||||||||
| 2009 | $ | 18,203 | $ | 21,880 | $ | 24,105 | $ | 24,412 | $ | 24,784 | $ | 24,829 | $ | 24,918 | $ | 25,103 | $ | 25,131 | $ | 25,233 | ||||||||||||||||||||
| 2010 | — | 18,100 | 21,491 | 21,633 | 22,844 | 22,810 | 22,938 | 23,063 | 23,123 | 23,120 | ||||||||||||||||||||||||||||||
| 2011 | — | — | 19,116 | 22,161 | 22,325 | 23,024 | 23,339 | 23,583 | 23,732 | 23,747 | ||||||||||||||||||||||||||||||
| 2012 | — | — | — | 18,681 | 21,434 | 21,888 | 22,640 | 22,726 | 23,073 | 23,271 | ||||||||||||||||||||||||||||||
| 2013 | — | — | — | — | 20,077 | 23,576 | 24,765 | 24,918 | 25,718 | 25,843 | ||||||||||||||||||||||||||||||
| 2014 | — | — | — | — | — | 22,744 | 25,727 | 27,076 | 27,443 | 28,281 | ||||||||||||||||||||||||||||||
| 2015 | — | — | — | — | — | — | 23,401 | 27,171 | 28,933 | 29,598 | ||||||||||||||||||||||||||||||
| 2016 | — | — | — | — | — | — | — | 29,009 | 35,845 | 37,307 | ||||||||||||||||||||||||||||||
| 2017 | — | — | — | — | — | — | — | — | 31,033 | 37,050 | ||||||||||||||||||||||||||||||
| 2018 | — | — | — | — | — | — | — | — | — | 34,358 | ||||||||||||||||||||||||||||||
| Total | $ | 287,808 | ||||||||||||||||||||||||||||||||||||||
| All outstanding liabilities prior to 2009, net of reinsurance | 19 | |||||||||||||||||||||||||||||||||||||||
| Liabilities for Unpaid Losses and Loss Adjustment Expenses, net of reinsurance | $ | 17,978 | ||||||||||||||||||||||||||||||||||||||
84
| Non- Standard Auto (Primero) | Incurred Claims and Allocated Claim Adjustment Expenses, Net of Reinsurance For the Year Ended December 31, | At December 31, 2018 | ||||||||||||||||||||||||||||||||||||||||||||||
| (prior years unaudited) | ||||||||||||||||||||||||||||||||||||||||||||||||
| Accident Year | 2009 | 2010 | 2011 | 2012 | 2013 | 2014 | 2015 | 2016 | 2017 | 2018 | Total IBNR Plus Expected Development on Reported Claims | Cumulative Number of Reported Claims | ||||||||||||||||||||||||||||||||||||
| (in thousands, except claim counts) | ||||||||||||||||||||||||||||||||||||||||||||||||
| 2009 | $ | 13,269 | $ | 12,790 | $ | 12,702 | $ | 12,655 | $ | 12,604 | $ | 12,586 | $ | 12,584 | $ | 12,584 | $ | 12,584 | $ | 12,585 | $ | — | 3,250 | |||||||||||||||||||||||||
| 2010 | — | 8,462 | 8,536 | 8,442 | 8,411 | 8,410 | 8,400 | 8,400 | 8,402 | 8,405 | — | 2,093 | ||||||||||||||||||||||||||||||||||||
| 2011 | — | — | 8,129 | 8,173 | 8,178 | 8,191 | 8,168 | 8,168 | 8,168 | 8,178 | — | 1,939 | ||||||||||||||||||||||||||||||||||||
| 2012 | — | — | — | 8,749 | 8,491 | 8,369 | 8,361 | 8,302 | 8,312 | 8,324 | — | 2,048 | ||||||||||||||||||||||||||||||||||||
| 2013 | — | — | — | — | 11,063 | 10,823 | 10,800 | 10,804 | 10,843 | 10,833 | 10 | 2,617 | ||||||||||||||||||||||||||||||||||||
| 2014 | — | — | — | — | — | 7,297 | 7,619 | 7,591 | 7,577 | 7,612 | 13 | 1,837 | ||||||||||||||||||||||||||||||||||||
| 2015 | — | — | — | — | — | — | 9,727 | 9,806 | 9,655 | 9,691 | 43 | 1,791 | ||||||||||||||||||||||||||||||||||||
| 2016 | — | — | — | — | — | — | — | 9,967 | 10,048 | 10,054 | 66 | 1,735 | ||||||||||||||||||||||||||||||||||||
| 2017 | — | — | — | — | — | — | — | — | 8,722 | 8,654 | 148 | 1,444 | ||||||||||||||||||||||||||||||||||||
| 2018 | — | — | — | — | — | — | — | — | — | 10,445 | 491 | 1,648 | ||||||||||||||||||||||||||||||||||||
| Total | $ | 94,781 | ||||||||||||||||||||||||||||||||||||||||||||||
| Non-Standard Auto (Primero) | Paid Claims and Allocated Claim Adjustment Expenses, Net of Reinsurance For the Year Ended December 31, | |||||||||||||||||||||||||||||||||||||||
| (prior years unaudited) | ||||||||||||||||||||||||||||||||||||||||
| Accident Year | 2009 | 2010 | 2011 | 2012 | 2013 | 2014 | 2015 | 2016 | 2017 | 2018 | ||||||||||||||||||||||||||||||
| 2009 | $ | 7,356 | $ | 11,621 | $ | 12,495 | $ | 12,624 | $ | 12,602 | $ | 12,584 | $ | 12,584 | $ | 12,584 | $ | 12,584 | $ | 12,585 | ||||||||||||||||||||
| 2010 | — | 4,788 | 7,792 | 8,332 | 8,411 | 8,410 | 8,400 | 8,400 | 8,402 | 8,405 | ||||||||||||||||||||||||||||||
| 2011 | — | — | 4,457 | 7,445 | 7,984 | 8,146 | 8,168 | 8,168 | 8,168 | 8,178 | ||||||||||||||||||||||||||||||
| 2012 | — | — | — | 4,377 | 7,522 | 7,983 | 8,276 | 8,302 | 8,312 | 8,324 | ||||||||||||||||||||||||||||||
| 2013 | — | — | — | — | 6,320 | 9,675 | 10,508 | 10,717 | 10,805 | 10,815 | ||||||||||||||||||||||||||||||
| 2014 | — | — | — | — | — | 3,733 | 6,707 | 7,423 | 7,521 | 7,579 | ||||||||||||||||||||||||||||||
| 2015 | — | — | — | — | — | — | 5,335 | 8,685 | 9,479 | 9,557 | ||||||||||||||||||||||||||||||
| 2016 | — | — | — | — | — | — | — | 5,409 | 8,882 | 9,790 | ||||||||||||||||||||||||||||||
| 2017 | — | — | — | — | — | — | — | — | 4,348 | 7,660 | ||||||||||||||||||||||||||||||
| 2018 | — | — | — | — | — | — | — | — | — | 5,492 | ||||||||||||||||||||||||||||||
| Total | $ | 88,385 | ||||||||||||||||||||||||||||||||||||||
| All outstanding liabilities prior to 2009, net of reinsurance | — | |||||||||||||||||||||||||||||||||||||||
| Liabilities for Unpaid Losses and Loss Adjustment Expenses, net of reinsurance | $ | 6,396 | ||||||||||||||||||||||||||||||||||||||
85
Non- (Direct | Incurred Claims and Allocated Claim Adjustment Expenses, Net of Reinsurance For the Year Ended December 31, | At December 31, 2018 | ||||||||||||||||||||||||||||||||||||||||||||||
| (prior years unaudited) | ||||||||||||||||||||||||||||||||||||||||||||||||
| Accident Year | 2009 | 2010 | 2011 | 2012 | 2013 | 2014 | 2015 | 2016 | 2017 | 2018 | Total IBNR Plus Expected Development on Reported Claims | Cumulative Number of Reported Claims | ||||||||||||||||||||||||||||||||||||
| (in thousands, except claim counts) | ||||||||||||||||||||||||||||||||||||||||||||||||
| 2009 | $ | 4,570 | $ | 4,064 | $ | 4,062 | $ | 4,141 | $ | 4,102 | $ | 4,124 | $ | 4,141 | $ | 4,139 | $ | 4,105 | $ | 4,158 | $ | 55 | 3,568 | |||||||||||||||||||||||||
| 2010 | — | 6,189 | 4,942 | 5,101 | 5,010 | 5,048 | 5,026 | 4,911 | 4,948 | 4,943 | 46 | 4,271 | ||||||||||||||||||||||||||||||||||||
| 2011 | — | — | 5,296 | 3,313 | 3,134 | 2,937 | 2,902 | 2,854 | 2,874 | 3,003 | 85 | 2,237 | ||||||||||||||||||||||||||||||||||||
| 2012 | — | — | — | 7,164 | 4,159 | 3,927 | 3,916 | 4,215 | 4,643 | 4,909 | 136 | 3,876 | ||||||||||||||||||||||||||||||||||||
| 2013 | — | — | — | — | 10,596 | 6,020 | 5,869 | 5,261 | 5,278 | 5,160 | 169 | 3,848 | ||||||||||||||||||||||||||||||||||||
| 2014 | — | — | — | — | — | 14,010 | 9,068 | 6,224 | 8,381 | 6,745 | 238 | 5,547 | ||||||||||||||||||||||||||||||||||||
| 2015 | — | — | — | — | — | — | 17,917 | 14,498 | 13,043 | 10,538 | (359 | ) | 10,353 | |||||||||||||||||||||||||||||||||||
| 2016 | — | — | — | — | — | — | — | 20,547 | 14,660 | 13,552 | 422 | 11,216 | ||||||||||||||||||||||||||||||||||||
| 2017 | — | — | — | — | — | — | — | — | 23,376 | 18,621 | 2,461 | 12,225 | ||||||||||||||||||||||||||||||||||||
| 2018 | — | — | — | — | — | — | — | — | — | 25,791 | (6,347 | ) | 14,460 | |||||||||||||||||||||||||||||||||||
| Total | $ | 97,420 | ||||||||||||||||||||||||||||||||||||||||||||||
Non-Standard (Direct Auto) | Paid Claims and Allocated Claim Adjustment Expenses, Net of Reinsurance For the Year Ended December 31, | |||||||||||||||||||||||||||||||||||||||
| (prior years unaudited) | ||||||||||||||||||||||||||||||||||||||||
| Accident Year | 2009 | 2010 | 2011 | 2012 | 2013 | 2014 | 2015 | 2016 | 2017 | 2018 | ||||||||||||||||||||||||||||||
| 2009 | $ | 1,747 | $ | 2,767 | $ | 3,246 | $ | 3,622 | $ | 3,774 | $ | 3,877 | $ | 4,010 | $ | 4,059 | $ | 4,072 | $ | 4,103 | ||||||||||||||||||||
| 2010 | — | 2,082 | 3,057 | 3,742 | 4,317 | 4,564 | 4,748 | 4,772 | 4,841 | 4,841 | ||||||||||||||||||||||||||||||
| 2011 | — | — | 1,290 | 1,890 | 2,342 | 2,590 | 2,761 | 2,830 | 2,851 | 2,925 | ||||||||||||||||||||||||||||||
| 2012 | — | — | — | 1,696 | 2,421 | 3,041 | 3,587 | 4,081 | 4,503 | 4,671 | ||||||||||||||||||||||||||||||
| 2013 | — | — | — | — | 1,944 | 3,123 | 3,796 | 4,291 | 4,602 | 4,808 | ||||||||||||||||||||||||||||||
| 2014 | — | — | — | — | — | 2,201 | 3,573 | 4,452 | 5,369 | 5,781 | ||||||||||||||||||||||||||||||
| 2015 | — | — | — | — | — | — | 2,967 | 5,202 | 7,057 | 8,327 | ||||||||||||||||||||||||||||||
| 2016 | — | — | — | — | — | — | — | 3,526 | 6,272 | 8,559 | ||||||||||||||||||||||||||||||
| 2017 | — | — | — | — | — | — | — | — | 4,385 | 6,981 | ||||||||||||||||||||||||||||||
| 2018 | — | — | — | — | — | — | — | — | — | 6,034 | ||||||||||||||||||||||||||||||
| Total | $ | 57,030 | ||||||||||||||||||||||||||||||||||||||
| All outstanding liabilities prior to 2009, net of reinsurance | — | |||||||||||||||||||||||||||||||||||||||
| Liabilities for Unpaid Losses and Loss Adjustment Expenses, net of reinsurance | $ | 40,390 | ||||||||||||||||||||||||||||||||||||||
86
| Home and Farm | Incurred Claims and Allocated Claim Adjustment Expenses, Net of Reinsurance For the Year Ended December 31, | At December 31, 2018 | ||||||||||||||||||||||||||||||||||||||||||||||
| (prior years unaudited) | ||||||||||||||||||||||||||||||||||||||||||||||||
| Accident Year | 2009 | 2010 | 2011 | 2012 | 2013 | 2014 | 2015 | 2016 | 2017 | 2018 | Total IBNR Plus Expected Development on Reported Claims | Cumulative Number of Reported Claims | ||||||||||||||||||||||||||||||||||||
| (in thousands, except claim counts) | ||||||||||||||||||||||||||||||||||||||||||||||||
| 2009 | $ | 16,584 | $ | 15,797 | $ | 15,657 | $ | 15,577 | $ | 16,065 | $ | 16,074 | $ | 16,001 | $ | 16,001 | $ | 16,001 | $ | 16,002 | $ | — | 4,022 | |||||||||||||||||||||||||
| 2010 | — | 23,477 | 23,007 | 22,454 | 22,209 | 22,198 | 22,202 | 22,190 | 22,190 | 22,190 | — | 5,348 | ||||||||||||||||||||||||||||||||||||
| 2011 | — | — | 31,948 | 32,104 | 32,113 | 31,771 | 31,684 | 31,388 | 31,306 | 31,313 | — | 6,087 | ||||||||||||||||||||||||||||||||||||
| 2012 | — | — | — | 25,179 | 24,439 | 24,320 | 24,091 | 24,081 | 24,079 | 24,088 | 1 | 3,608 | ||||||||||||||||||||||||||||||||||||
| 2013 | — | — | — | — | 29,976 | 29,217 | 28,531 | 28,315 | 28,286 | 28,315 | 178 | 4,185 | ||||||||||||||||||||||||||||||||||||
| 2014 | — | — | — | — | — | 36,663 | 36,001 | 35,770 | 35,589 | 35,684 | 103 | 5,240 | ||||||||||||||||||||||||||||||||||||
| 2015 | — | — | — | — | — | — | 32,789 | 31,818 | 31,297 | 31,577 | 308 | 3,918 | ||||||||||||||||||||||||||||||||||||
| 2016 | — | — | — | — | — | — | — | 45,825 | 44,510 | 44,945 | 301 | 6,296 | ||||||||||||||||||||||||||||||||||||
| 2017 | — | — | — | — | — | — | — | — | 42,110 | 41,593 | 679 | 4,868 | ||||||||||||||||||||||||||||||||||||
| 2018 | — | — | — | — | — | — | — | — | — | 42,515 | 921 | 4,191 | ||||||||||||||||||||||||||||||||||||
| Total | $ | 318,222 | ||||||||||||||||||||||||||||||||||||||||||||||
| Home and Farm | Paid Claims and Allocated Claim Adjustment Expenses, Net of Reinsurance For the Year Ended December 31, | |||||||||||||||||||||||||||||||||||||||
| (prior years unaudited) | ||||||||||||||||||||||||||||||||||||||||
| Accident Year | 2009 | 2010 | 2011 | 2012 | 2013 | 2014 | 2015 | 2016 | 2017 | 2018 | ||||||||||||||||||||||||||||||
| 2009 | $ | 12,657 | $ | 14,654 | $ | 14,904 | $ | 15,436 | $ | 15,935 | $ | 15,960 | $ | 16,000 | $ | 16,001 | $ | 16,001 | $ | 16,002 | ||||||||||||||||||||
| 2010 | — | 19,902 | 21,940 | 21,955 | 22,068 | 22,117 | 22,154 | 22,190 | 22,190 | 22,190 | ||||||||||||||||||||||||||||||
| 2011 | — | — | 29,399 | 33,019 | 31,126 | 31,460 | 31,702 | 31,277 | 31,304 | 31,313 | ||||||||||||||||||||||||||||||
| 2012 | — | — | — | 21,761 | 23,863 | 24,029 | 24,168 | 24,075 | 24,076 | 24,087 | ||||||||||||||||||||||||||||||
| 2013 | — | — | — | — | 23,354 | 26,934 | 27,183 | 27,221 | 27,456 | 27,495 | ||||||||||||||||||||||||||||||
| 2014 | — | — | — | — | — | 32,207 | 35,199 | 35,219 | 35,371 | 35,481 | ||||||||||||||||||||||||||||||
| 2015 | — | — | — | — | — | — | 27,204 | 30,164 | 30,350 | 30,573 | ||||||||||||||||||||||||||||||
| 2016 | — | — | — | — | — | — | — | 37,656 | 44,942 | 44,270 | ||||||||||||||||||||||||||||||
| 2017 | — | — | — | — | — | — | — | — | 34,657 | 38,928 | ||||||||||||||||||||||||||||||
| 2018 | — | — | — | — | — | — | — | — | — | 37,881 | ||||||||||||||||||||||||||||||
| Total | $ | 308,220 | ||||||||||||||||||||||||||||||||||||||
| All outstanding liabilities prior to 2009, net of reinsurance | — | |||||||||||||||||||||||||||||||||||||||
| Liabilities for Unpaid Losses and Loss Adjustment Expenses, net of reinsurance | $ | 10,002 | ||||||||||||||||||||||||||||||||||||||
87
| Crop | Incurred Claims and Allocated Claim Adjustment Expenses, Net of Reinsurance For the Year Ended December 31, | At December 31, 2018 | ||||||||||||||||||||||||||||||||||||||||||||||
| (prior years unaudited) | ||||||||||||||||||||||||||||||||||||||||||||||||
| Accident Year | 2009 | 2010 | 2011 | 2012 | 2013 | 2014 | 2015 | 2016 | 2017 | 2018 | Total IBNR Plus Expected Development on Reported Claims | Cumulative Number of Reported Claims | ||||||||||||||||||||||||||||||||||||
| (in thousands, except claim counts) |
||||||||||||||||||||||||||||||||||||||||||||||||
| 2009 | $ | 17,517 | $ | 15,450 | $ | 15,450 | $ | 15,450 | $ | 15,450 | $ | 15,450 | $ | 15,450 | $ | 15,450 | $ | 15,450 | $ | 15,450 | $ | — | 2,367 | |||||||||||||||||||||||||
| 2010 | — | 20,742 | 20,717 | 20,717 | 20,717 | 20,717 | 20,717 | 20,717 | 20,717 | 20,717 | — | 2,108 | ||||||||||||||||||||||||||||||||||||
| 2011 | — | — | 55,094 | 54,953 | 59,651 | 59,651 | 59,651 | 59,651 | 59,651 | 59,651 | — | 3,211 | ||||||||||||||||||||||||||||||||||||
| 2012 | — | — | — | 13,546 | 13,676 | 13,673 | 13,673 | 13,673 | 13,673 | 13,673 | — | 2,137 | ||||||||||||||||||||||||||||||||||||
| 2013 | — | — | — | — | 40,976 | 39,665 | 39,665 | 39,665 | 39,665 | 39,665 | — | 2,097 | ||||||||||||||||||||||||||||||||||||
| 2014 | — | — | — | — | — | 22,686 | 20,333 | 20,333 | 20,333 | 20,333 | — | 2,268 | ||||||||||||||||||||||||||||||||||||
| 2015 | — | — | — | — | — | — | 13,813 | 13,849 | 13,849 | 13,849 | — | 2,427 | ||||||||||||||||||||||||||||||||||||
| 2016 | — | — | — | — | — | — | — | 20,209 | 19,582 | 19,487 | — | 2,806 | ||||||||||||||||||||||||||||||||||||
| 2017 | — | — | — | — | — | — | — | — | 33,733 | 34,181 | — | 2,968 | ||||||||||||||||||||||||||||||||||||
| 2018 | — | — | — | — | — | — | — | — | — | 12,506 | 56 | 2,116 | ||||||||||||||||||||||||||||||||||||
| Total | $ | 249,512 | ||||||||||||||||||||||||||||||||||||||||||||||
| Crop | Paid Claims and Allocated Claim Adjustment Expenses, Net of Reinsurance For the Year Ended December 31, | |||||||||||||||||||||||||||||||||||||||
| (prior years unaudited) | ||||||||||||||||||||||||||||||||||||||||
| Accident Year | 2009 | 2010 | 2011 | 2012 | 2013 | 2014 | 2015 | 2016 | 2017 | 2018 | ||||||||||||||||||||||||||||||
| 2009 | $ | 13,462 | $ | 15,450 | $ | 15,450 | $ | 15,450 | $ | 15,450 | $ | 15,450 | $ | 15,450 | $ | 15,450 | $ | 15,450 | $ | 15,450 | ||||||||||||||||||||
| 2010 | — | 19,678 | 20,717 | 20,717 | 20,717 | 20,717 | 20,717 | 20,717 | 20,717 | 20,717 | ||||||||||||||||||||||||||||||
| 2011 | — | — | 57,741 | 59,651 | 59,651 | 59,651 | 59,651 | 59,651 | 59,651 | 59,651 | ||||||||||||||||||||||||||||||
| 2012 | — | — | — | 13,078 | 13,673 | 13,673 | 13,673 | 13,673 | 13,673 | 13,673 | ||||||||||||||||||||||||||||||
| 2013 | — | — | — | — | 35,511 | 39,665 | 39,665 | 39,665 | 39,665 | 39,665 | ||||||||||||||||||||||||||||||
| 2014 | — | — | — | — | — | 17,788 | 20,333 | 20,333 | 20,333 | 20,333 | ||||||||||||||||||||||||||||||
| 2015 | — | — | — | — | — | — | 12,866 | 13,849 | 13,849 | 13,849 | ||||||||||||||||||||||||||||||
| 2016 | — | — | — | — | — | — | — | 16,444 | 19,487 | 19,487 | ||||||||||||||||||||||||||||||
| 2017 | — | — | — | — | — | — | — | — | 32,767 | 34,181 | ||||||||||||||||||||||||||||||
| 2018 | — | — | — | — | — | — | — | — | — | 10,764 | ||||||||||||||||||||||||||||||
| Total | $ | 247,770 | ||||||||||||||||||||||||||||||||||||||
| All outstanding liabilities prior to 2009, net of reinsurance | — | |||||||||||||||||||||||||||||||||||||||
| Liabilities for Unpaid Losses and Loss Adjustment Expenses, net of reinsurance | $ | 1,742 | ||||||||||||||||||||||||||||||||||||||
88
The following table presents a reconciliation of the net incurred and paid claims development tables to the liability for unpaid losses and loss adjustment expenses in our Consolidated Balance Sheet:
| December 31, 2018 | ||||
| Net outstanding liabilities: | ||||
| Private passenger auto | $ | 17,978 | ||
| Non-standard auto (Primero) | 6,396 | |||
| Non-standard auto (Direct Auto) | 40,390 | |||
| Home and farm | 10,002 | |||
| Crop | 1,742 | |||
| All other | 8,381 | |||
| 84,889 | ||||
| Reinsurance ceded: | ||||
| Private passenger auto | 176 | |||
| Non-standard auto | — | |||
| Home and farm | 730 | |||
| Crop | 384 | |||
| All other | 942 | |||
| 2,232 | ||||
| Gross liability for unpaid losses and loss adjustment expenses | $ | 87,121 | ||
The following table presents required supplementary information about average historical claims duration as of December 31, 2018:
| Average Annual Percentage Payout of Incurred Claims by Age, Net of Reinsurance | ||||||||||||||||||||||||||||||||||||||||
| Years | 1 | 2 | 3 | 4 | 5 | 6 | 7 | 8 | 9 | 10 | ||||||||||||||||||||||||||||||
| Private Passenger Auto | 52.9% | 21.0% | 11.1% | 6.3% | 3.7% | 2.5% | 1.5% | 0.5% | 0.1% | — | ||||||||||||||||||||||||||||||
| Non-Standard Auto (Primero) | 80.0% | 15.3% | 3.4% | 0.9% | 0.2% | 0.1% | 0.1% | — | — | — | ||||||||||||||||||||||||||||||
| Non-Standard Auto (Direct Auto) | 39.9% | 24.0% | 13.9% | 8.1% | 6.3% | 3.2% | 2.0% | 0.9% | 1.1% | 0.6% | ||||||||||||||||||||||||||||||
| Home and Farm | 70.9% | 8.0% | 10.7% | 4.1% | 2.4% | 3.2% | 0.1% | 0.2% | 0.3% | 0.1% | ||||||||||||||||||||||||||||||
| Crop | 93.4% | 4.5% | 2.1% | — | — | — | — | — | — | — | ||||||||||||||||||||||||||||||
89
11. Property and Equipment
Property and equipment consisted of the following:
| December 31, | ||||||||||
| 2018 | 2017 | Estimated Useful Life | ||||||||
| Cost: | ||||||||||
| Real estate | $ | 11,911 | $ | 10,633 | 10 - 31 years | |||||
| Electronic data processing equipment | 1,286 | 1,288 | 5-7 years | |||||||
| Furniture and fixtures | 2,829 | 3,511 | 5-7 years | |||||||
| Automobiles | 1,596 | 1,595 | 2-3 years | |||||||
| Gross cost | 17,622 | 17,027 | ||||||||
| Accumulated depreciation | (10,643 | ) | (11,150 | ) | ||||||
| Total property and equipment, net | $ | 6,979 | $ | 5,877 | ||||||
Depreciation expense was $492, $500, and $441 during the years ended December 31, 2018, 2017 and 2016, respectively.
12. Related Party Transactions
We were organized by the NDFB to provide insurance protection for its members. We have a royalty agreement with the NDFB that recognizes the use of their trademark and provides royalties to the NDFB based on the premiums written on Nodak Insurance’s insurance policies. Royalties paid to the NDFB were $1,315, $1,289, and $1,258 during the years ended December 31, 2018, 2017, and 2016 respectively. Royalty amounts payable of $108 and $99 were accrued as a liability to the NDFB at December 31, 2018 and December 31, 2017, respectively.
State insurance laws require our insurance subsidiaries to maintain certain minimum capital and surplus amounts on a statutory basis. Our insurance subsidiaries are subject to regulations that restrict the payment of dividends from statutory surplus and may require prior approval from their domiciliary insurance regulatory authorities. Our insurance subsidiaries are also subject to risk-based capital (“RBC”) requirements that may further affect their ability to pay dividends. Our insurance subsidiaries statutory capital and surplus at December 31, 2018 exceeded the amount of statutory capital and surplus necessary to satisfy regulatory requirements, including the RBC requirements, by a significant margin.
The amount available for payment of dividends from Nodak Insurance to NI Holdings during 2019 without the prior approval of the North Dakota Insurance Department is $17,588 based upon the policyholders’ surplus of Nodak Insurance at December 31, 2018. Prior to its payment of any extraordinary dividend, Nodak Insurance will be required to provide notice of the dividend to the North Dakota Insurance Department. This notice must be provided to the North Dakota Insurance Department 30 days prior to the payment of an extraordinary dividend and 10 days prior to the payment of an ordinary dividend. The North Dakota Insurance Department has the power to limit or prohibit dividend payments if Nodak Insurance is in violation of any law or regulation. These restrictions or any subsequently imposed restrictions may affect our future liquidity. No dividends were declared or paid by Nodak Insurance during the years ended December 31, 2018 or 2017.
The amount available for payment of dividends from Direct Auto to NI Holdings during 2019 without the prior approval of the Illinois Department of Insurance is $6,653 based upon the policyholders’ surplus of Direct Auto at December 31, 2018. Prior to its payment of any dividend, Direct Auto will be required to provide notice of the dividend to the Illinois Department of Insurance. This notice must be provided to the Illinois Department of Insurance within five business days following declaration of any dividend and no less than 30 days prior to the payment of an extraordinary dividend or 10 days prior to the payment of an ordinary dividend. The Illinois Department of Insurance has the power to limit or prohibit dividend payments if Direct Auto is in violation of any law or regulation. These restrictions or any subsequently imposed restrictions may affect our future liquidity. No dividends were declared or paid by Direct Auto during the year ended December 31, 2018.
90
The following table illustrates the impact of including Battle Creek in our Consolidated Balance Sheets prior to intercompany eliminations:
| December 31, | ||||||||
| 2018 | 2017 | |||||||
| Assets: | ||||||||
| Cash and cash equivalents (overdraft) | $ | (818 | ) | $ | (726 | ) | ||
| Investments | 4,304 | 4,364 | ||||||
| Premiums and agents’ balances receivable | 4,479 | 4,055 | ||||||
| Reinsurance recoverables on losses (1) | 21,117 | 20,932 | ||||||
| Accrued investment income | 31 | 29 | ||||||
| Deferred income tax asset, net | 414 | 389 | ||||||
| Property and equipment | 356 | 370 | ||||||
| Other assets | 48 | 54 | ||||||
| Total assets | $ | 29,931 | $ | 29,467 | ||||
| Liabilities: | ||||||||
| Unpaid losses and loss adjustment expenses | $ | 6,579 | $ | 7,995 | ||||
| Unearned premiums | 14,538 | 12,937 | ||||||
| Notes payable (1) | 3,000 | 3,000 | ||||||
| Reinsurance premiums payable (1) | 972 | 965 | ||||||
| Accrued expenses and other liabilities | 1,579 | 1,392 | ||||||
| Total liabilities | 26,668 | 26,289 | ||||||
| Equity: | ||||||||
| Non-controlling interest | 3,263 | 3,178 | ||||||
| Total equity | 3,263 | 3,178 | ||||||
| Total liabilities and equity | $ | 29,931 | $ | 29,467 | ||||
| (1) Amount eliminated in consolidation. | ||||||||
Total statutory revenues of Battle Creek, after intercompany eliminations, which is limited to net investment income, were $159, $153, and $174 during the year ended December 31, 2018, 2017, and 2016, respectively. There were no statutory-basis expenses reported, after intercompany eliminations, during the years ended December 31, 2018, 2017, and 2016.
13. Benefit Plans
The Company sponsors a money purchase plan that covers all eligible employees. Plan costs are funded annually as they are earned. The Company’s contributions expense to the money purchase plan totaled $598, $854, and $762 during the years ended December 31, 2018, 2017, and 2016, respectively.
The Company also sponsors a 401(k) plan with an automatic contribution to all eligible employees and a matching contribution for eligible employees of 50% up to 3% of eligible compensation. The Company’s contributions expense to the 401(k) plan totaled $475, $411, and $422 during the years ended December 31, 2018, 2017, and 2016, respectively. All fees associated with both plans are deducted from the eligible employee accounts.
Deferred Compensation Plan
Effective April 28, 2016, the Board of Directors authorized a non-qualified deferred compensation plan covering key executives of the Company as designated by the Board of Directors. The Company’s policy is to fund the plan in a given calendar year by amounts that exceed the maximum contribution allowed by the Employee Retirement Income Security Act (“ERISA”), beginning in 2017. The Company’s expenses included $451 and $183 for the years ended December 31, 2018 and 2017, respectively.
Employee Stock Ownership Plan
The Company has established an Employee Stock Ownership Plan (the “ESOP”). The ESOP is intended to be an employee stock ownership plan within the meaning of Internal Revenue Code Section 4975(e)(7) and will invest primarily in common stock of the Company.
91
In connection with our initial public offering in March 2017, Nodak Insurance loaned $2,400 to the ESOP’s related trust (the “ESOP Trust”). The ESOP loan will be for a period of ten years and bears interest at the long-term Applicable Federal Rate effective on the closing date of the offering (2.79% annually). The ESOP Trust used the proceeds of the loan to purchase shares in our initial public offering, which results in the ESOP Trust owning approximately 1.0% of the Company’s authorized shares. The ESOP has purchased the shares for investment and not for resale.
The shares purchased by the ESOP Trust in the offering are held in a suspense account as collateral for the ESOP loan. The shares held in the ESOP’s suspense account are not considered outstanding for earnings per share purposes. Nodak Insurance will make semi-annual cash contributions to the ESOP in amounts no smaller than the amounts required for the ESOP Trust to make its loan payments to Nodak Insurance. While the ESOP makes two loan payments per year, a pre-determined portion of the shares will be released from the suspense account and allocated to participant accounts at the end of the calendar year. This release and allocation will occur on an annual basis over the ten-year term of the ESOP loan. Nodak Insurance will have a lien on the shares of common stock of the Company held by the ESOP to secure repayment of the loan from the ESOP to Nodak Insurance. If the ESOP is terminated as a result of a change in control of the Company, the ESOP may be required to pay the costs of terminating the plan.
It is anticipated that the only assets held by the ESOP will be shares of the Company’s common stock. Participants in the ESOP cannot direct the investment of any assets allocated to their accounts. The initial ESOP participants are employees of Nodak Insurance. The employees of Primero and Direct Auto will not participate in the ESOP. American West and Battle Creek have no employees.
Each employee of Nodak Insurance will automatically become a participant in the ESOP if such employee is at least 21 years old, has completed a minimum of one thousand hours of service with Nodak Insurance, and has completed an Eligibility Computation Period. Employees are not permitted to make any contributions to the ESOP. Participants in the ESOP will receive annual reports from the Company showing the number of shares of common stock of the Company allocated to the participant’s account and the market value of those shares. The shares are allocated to participants based on compensation as provided for in the ESOP.
In connection with the initial public offering, the Company created a contra-equity account on the Company’s Consolidated Balance Sheet equal to the ESOP’s basis in the shares. The basis of those shares was set at $10.00 per share as part of the initial public offering. As shares are released from the ESOP suspense account, the contra-equity account will be credited, which shall reduce the impact of the contra-equity account on the Company’s Consolidated Balance Sheet. The Company shall record a compensation expense related to the shares released, which compensation expense is equal to the number of shares released from the suspense account multiplied by the average market value of the Company’s stock during the period.
The Company recognized compensation expense of $400 and $401 during the years ended December 31, 2018 and 2017, respectively.
Through December 31, 2018, 48,630 ESOP shares had been released and allocated to participants, with the remainder of 191,370 ESOP shares held in suspense at December 31, 2018. Using the Company’s year-end market price of $15.73, the fair value of the unearned ESOP shares was $3,010 at December 31, 2018.
14. Line of Credit
Nodak Insurance has a $5,000 line of credit with Wells Fargo Bank, N.A. There were no outstanding amounts during the years ended December 31, 2018, 2017, or 2016. This line of credit is scheduled to expire on December 31, 2019.
92
15. Income Taxes
The components of our provision for income tax expense were as follows:
| Year Ended December 31, | ||||||||||||
| 2018 | 2017 | 2016 | ||||||||||
| Current | $ | 8,020 | $ | 8,461 | $ | 1,564 | ||||||
| Deferred | (692 | ) | (2,067 | ) | (85 | ) | ||||||
| Total provision | $ | 7,328 | $ | 6,394 | $ | 1,479 | ||||||
The provision for income taxes differs from the amount that would be computed by applying the statutory federal rate to income before provision for income taxes as a result of the following:
| Year Ended December 31, | ||||||||||||
| 2018 | 2017 | 2016 | ||||||||||
| Income before income taxes | $ | 38,572 | $ | 22,006 | $ | 6,117 | ||||||
| Expected provision for federal income taxes | $ | 8,100 | $ | 7,702 | $ | 2,141 | ||||||
| Permanent differences | (126 | ) | (736 | ) | (670 | ) | ||||||
| Change in valuation allowance | (41 | ) | (394 | ) | (62 | ) | ||||||
| Stock conversion and IPO expenses | — | 568 | — | |||||||||
| Impact of effective tax rate change on deferred income tax assets and liabilities | — | (1,274 | ) | — | ||||||||
| Other | (605 | ) | 528 | 70 | ||||||||
| Total provision | $ | 7,328 | $ | 6,394 | $ | 1,479 | ||||||
Income tax expense for the year ended December 31, 2017 includes a reduction of $1,274 to current income tax expense due to a new corporate income tax rate for tax year 2018 and beyond, enacted on December 22, 2017. Accounting guidance requires that companies re-measure existing deferred income tax assets (including loss carryforwards) and liabilities when a change in tax rate occurs and record an offset for the net amount of the change as a component of income tax expense from continuing operations in the period of enactment. The guidance also requires any change to a previously recorded valuation allowance as a result of re-measuring existing temporary differences and loss carryforwards to be reflected as a component of income tax expense from continuing operations. The valuation allowance against certain deferred income tax assets was $587, $628, and $1,022 at December 31, 2018, 2017, and 2016, respectively.
93
The income tax effects of temporary differences that give rise to significant portions of our deferred income tax assets and deferred income tax liabilities, valued at the new effective tax rate of 21% at December 31, 2018 and 2017, are as follows:
| December 31, | ||||||||
| 2018 | 2017 | |||||||
| Deferred income tax assets: | ||||||||
| Unearned premium | $ | 3,560 | $ | 2,657 | ||||
| Unpaid losses and loss adjustment expenses | 580 | 251 | ||||||
| Carryovers | 1,005 | 1,040 | ||||||
| Other | 596 | 331 | ||||||
| Total deferred income tax assets | 5,741 | 4,279 | ||||||
| Deferred income tax liabilities: | ||||||||
| Deferred policy acquisition costs | 2,702 | 1,860 | ||||||
| Net unrealized gains on investments | 2,688 | 4,266 | ||||||
| Intangibles | 398 | — | ||||||
| Other | 77 | 64 | ||||||
| Total deferred income tax liabilities | 5,865 | 6,190 | ||||||
| Net deferred income tax liability | (124 | ) | (1,911 | ) | ||||
| Valuation allowance | (587 | ) | (628 | ) | ||||
| Deferred income tax liability, net | $ | (711 | ) | $ | (2,539 | ) | ||
At December 31, 2018 and 2017, we had no unrecognized tax benefits, no accrued interest and penalties, and no significant uncertain tax positions. No interest and penalties were recognized during the years ended December 31, 2018, 2017, or 2016.
At December 31, 2018 and 2017, the Company, other than Battle Creek, had no income tax related carryovers for net operating losses, alternative minimum tax credits, or capital losses. Battle Creek, which files its income tax returns on a stand-alone basis, had net operating loss carryovers of $4,786 and $4,951 at December 31, 2018 and 2017, respectively. The net operating loss carryforward expires beginning in 2021 through 2030.
16. Operating Leases
Our Primero subsidiary leases a facility in Spearfish, South Dakota under a non-cancellable operating lease expiring in 2023. Our Direct Auto subsidiary leases a facility in Chicago, Illinois under a non-cancellable operating lease expiring in 2020. We leased equipment and software under non-cancellable operating leases expiring at various times through 2017. There were expenses of $140, $80, and $74 related to these leases during the years ended December 31, 2018, 2017, and 2016, respectively.
As of December 31, 2018, we have minimum future commitments under non-cancellable leases as follows:
| Year ending December 31, | Estimated Future Minimum Commitments | |||
| 2019 | $ | 301 | ||
| 2020 | 121 | |||
| 2021 | 60 | |||
| 2022 | 60 | |||
| 2023 | 30 | |||
We also sub-lease a portion of our home office building under non-cancellable operating leases.
17. Contingencies
We have been named as a defendant in various lawsuits relating to our insurance operations. Contingent liabilities arising from litigation, income taxes, and other matters are not considered to be material to our financial position.
The Company does not have any unrecorded or potential contingent liabilities or material commitments requiring the use of assets as of December 31, 2018 and 2017.
94
18. Common Stock
Changes in the number of common stock shares outstanding are as follows:
| Year Ended December 31, | ||||||||
| 2018 | 2017 | |||||||
| Shares outstanding, beginning | 22,337,644 | — | ||||||
| Initial public offering | — | 23,000,000 | ||||||
| Shares repurchased related to employee stock ownership plan | — | (240,000 | ) | |||||
| Treasury shares repurchased through stock repurchase authorization | (191,265 | ) | (446,671 | ) | ||||
| Issuance of treasury shares for vesting of stock awards | 22,200 | — | ||||||
| Issuance of shares related to employee stock ownership plan | 24,315 | 24,315 | ||||||
| Shares outstanding, ending | 22,192,894 | 22,337,644 | ||||||
| Note: Shares were not available prior to the Company’s IPO in March 2017. | ||||||||
On May 23, 2017, our Board of Directors approved an authorization for the repurchase of up to $8 million of the Company’s outstanding common stock. We completed the repurchase of 446,671 shares of our common stock for $8,037 during the three months ended June 30, 2017, and reflected the cost of this treasury stock as a reduction of Equity within our Consolidated Balance Sheet as of December 31, 2018 and 2017.
On February 28, 2018, our Board of Directors approved an authorization for the repurchase of up to approximately $10 million of the Company’s outstanding common stock. We completed the repurchase of 191,265 shares of our common stock for $2,996 during the three months ended December 31, 2018, and reflected the cost of this treasury stock as a reduction of Equity within our Consolidated Balance Sheet as of December 31, 2018.
19. Stock Based Compensation
At its 2017 Annual Shareholders’ Meeting, the NI Holdings 2017, Inc. Stock and Incentive Plan (the “Plan”) was approved by shareholders. The purpose of the Plan is to promote the interests of the Company and its shareholders by aiding the Company in attracting and retaining employees, officers, consultants, advisors, and non-employee directors capable of assuring the future success of the Company, to offer such persons incentives to put forth maximum efforts for the success of the Company’s business, to compensate such persons through various stock and cash-based arrangements, and to provide them with opportunities for stock ownership in the Company, thereby aligning the interests of such persons with the Company’s shareholders.
The Plan provides for the grant of nonqualified stock options, incentive stock options, restricted stock units (“RSUs”), stock appreciation rights, dividend equivalents, and performance share units (“PSUs”) to employees, officers, consultants, advisors, non-employee directors, and independent contractors designated by the Compensation Committee of the Board of Directors (the “Compensation Committee”). Awards made under the Plan are based upon, among other things, a participant’s level of responsibility and performance within the Company.
The total aggregate number of shares of common stock that awards may be issued under all awards made under the Plan shall not exceed 500,000 shares of common stock, subject to adjustments as provided in the Plan. No eligible participant may be granted more than 100,000 shares from any stock options, stock appreciation rights, or performance awards denominated in shares, in the aggregate in any calendar year, subject to adjustment in accordance with the Plan. The aggregate amount payable pursuant to all performance awards denominated in cash to any eligible person in any calendar year is limited to $1,000 in value. Directors who are not also employees of the Company may not be granted awards denominated in shares that exceed $100 in any calendar year.
Restricted Stock Units
On December 1, 2017, the Compensation Committee awarded RSUs to non-employee directors and select executives. RSUs are promises to issue actual shares of common stock at the end of a vesting period. The RSUs granted to executives under the Plan were based on salary and generally vest 20% per year over a five-year period, while RSUs granted to non-employee directors vested in May 2018. Dividend equivalents on RSUs are accrued during the vesting period and paid in cash at the end of the vesting period, but are subject to forfeiture until the underlying shares become vested. Participants do not have voting rights with respect to RSUs. On March 1, 2018, the first tranche of executive RSUs vested.
On March 1, 2018, the Compensation Committee awarded additional RSUs to select executives with the same terms as the previous awards.
95
On May 22, 2018, the RSUs awarded to non-employee directors vested and additional RSUs were awarded to non-employee directors to vest on the date of the next annual meeting of shareholders.
The Company recognizes stock-based compensation costs based on the grant date fair value over the vesting period of the awards. Estimated forfeitures are included in the determination of compensation costs. No forfeitures are currently estimated.
A summary of the Company’s outstanding restricted stock units is presented below:
| Shares | Weighted-Average Fair Value Per Share | |||||||
| Units outstanding at January 1, 2017 | — | $ | — | |||||
| RSUs granted during 2017 | 83,000 | 17.31 | ||||||
| RSUs vested during 2017 | (17,500 | ) | 17.31 | |||||
| Units outstanding at December 31, 2017 | 65,500 | $ | 17.31 | |||||
| RSUs granted during 2018 | 40,000 | 16.25 | ||||||
| RSUs vested during 2018 | (31,620 | ) | 16.99 | |||||
| Units outstanding at December 31, 2018 | 73,880 | $ | 16.87 | |||||
The following table shows the impact of RSU activity to the Company’s financial results:
| Year Ended December 31, | ||||||||
| 2018 | 2017 | |||||||
| RSU compensation expense | $ | 999 | $ | 423 | ||||
| Income tax benefit | (210 | ) | (148 | ) | ||||
| RSU compensation expense, net of income taxes | $ | 789 | $ | 275 | ||||
| Total grant-date fair value of vested RSUs at end of period | $ | 840 | $ | 303 | ||||
| Note: Share-based compensation was not available prior to the Company’s IPO in March 2017. | ||||||||
At December 31, 2018, there was $664 of unrecognized compensation cost related to outstanding RSUs. That cost is expected to be recognized over a weighted-average period of 3.31 years.
Performance Stock Units
On March 1, 2018, the Compensation Committee awarded PSUs to select executives. PSUs are promises to issue actual shares of common stock at the end of a vesting period, if certain performance conditions are met. The PSUs granted to employees under the Plan were based on salary and include a three-year book value cumulative growth target with threshold and stretch goals. They will vest on the third anniversary of the grant date, subject to the participant’s continuous employment through the vesting date and the level of performance achieved. Dividend equivalents on PSUs are accrued and paid in cash at the end of the performance period in accordance with the level of performance achieved, but are subject to forfeiture until the underlying shares become vested. Participants do not have voting rights with respect to PSUs.
The Company recognizes stock-based compensation costs based on the grant date fair value over the performance period of the awards. Estimated forfeitures are included in the determination of compensation costs. No forfeitures are currently estimated. The current cost estimate assumes that the cumulative growth target will be achieved.
96
A summary of the Company’s outstanding PSUs for the year ended December 31, 2018, is presented below:
| Performance Share Units | Weighted-Average Fair Value Per Share | |||||||
| Units outstanding at January 1, 2018 | — | $ | — | |||||
| PSUs granted during 2018 (at target) | 48,600 | 16.25 | ||||||
| Units outstanding at December 31, 2018 | 48,600 | $ | 16.25 | |||||
The following table shows the impact of PSU activity to the Company’s financial results:
| Year Ended December 31, | ||||||||
| 2018 | 2017 | |||||||
| PSU compensation expense | $ | 233 | $ | — | ||||
| Income tax benefit | (49 | ) | — | |||||
| PSU compensation expense, net of income taxes | $ | 184 | $ | n/a | ||||
| Total grant-date fair value of vested PSUs at end of period | $ | — | $ | n/a | ||||
| Note: Share-based compensation was not available prior to the Company’s IPO in March 2017. | ||||||||
The PSU grants above represent initial target awards and do not reflect potential increases or decreases resulting from financial performance objectives to be determined at the end of the performance period. The actual number of shares to be issued at the end of the performance period will range from 0% to 150% of the initial target awards.
At December 31, 2018, there was $556 of unrecognized compensation cost related to outstanding PSUs. That cost is expected to be recognized over a weighted-average period of 2.00 years.
20. Earnings Per Share
As described in Note 1, the conversion of the mutual company to a stock company resulted in the issuance of NI Holdings common shares on March 13, 2017. Earnings per share is computed by dividing net income available to common shareholders for the period by the weighted average number of common shares outstanding for the same period. The weighted average number of common shares outstanding was 22,358,858 and 22,512,401 for the years ended December 31, 2018 and 2017, respectively. For the period prior to the date of the conversion, we assumed that the net common shares issued in the initial public offering of 22,760,000 shares were outstanding since January 1, 2017.
Unearned ESOP shares are not considered outstanding until they are released and allocated to plan participants. Unearned RSU and PSU shares are not considered outstanding until they are earned by award participants.
97
The following table presents a reconciliation of the numerators and denominators we used in the basic and diluted per share computations for our common stock:
| Year Ended December 31, | ||||||||||||
| 2018 | 2017 | 2016 | ||||||||||
| Basic earnings per common share: | ||||||||||||
| Numerator: | ||||||||||||
| Net income attributable to NI Holdings | $ | 31,081 | $ | 15,991 | $ | 4,551 | ||||||
| Denominator: | ||||||||||||
| Weighted average shares outstanding | 22,358,858 | 22,512,401 | n/a | |||||||||
| Basic earnings per common share | $ | 1.39 | $ | 0.71 | $ | n/a | ||||||
| Diluted earnings per common share: | ||||||||||||
| Numerator: | ||||||||||||
| Net income attributable to NI Holdings | $ | 31,081 | $ | 15,991 | $ | 4,551 | ||||||
| Denominator: | ||||||||||||
| Number of shares used in basic computation | 22,358,858 | 22,512,401 | n/a | |||||||||
| Weighted average effect of dilutive securities | ||||||||||||
| Add: Restricted stock units and performance share units | 26,896 | 228 | n/a | |||||||||
| Number of shares used in diluted computation | 22,385,754 | 22,512,629 | n/a | |||||||||
| Diluted earnings per common share | $ | 1.39 | $ | 0.71 | $ | n/a | ||||||
98
21. Segment Information
We have four primary reportable operating segments, which consist of private passenger auto insurance, non-standard auto insurance, home and farm insurance, and crop insurance. A fifth segment captures all other insurance coverages we sell, including commercial coverages and our assumed reinsurance lines of business. We operate only in the United States, and no single customer or agent provides 10 percent or more of our revenues. The following tables provide available information of these segments for the years ended December 31, 2018, 2017, and 2016. For presentation in these tables, “LAE” refers to loss adjustment expenses.
The ratios presented in these tables are non-GAAP financial measures under Securities and Exchange Commission rules and regulations. The non-GAAP ratios may not be comparable to similarly-named measures reported by other companies.
The loss and LAE ratio equals losses and loss adjustment expenses divided by net premiums earned. The expense ratio equals amortization of deferred policy acquisition costs and other underwriting and general expenses, divided by net premiums earned. The combined ratio equals losses and loss adjustment expenses, amortization of deferred policy acquisition costs, and other underwriting and general expenses, divided by net premiums earned.
99
| Year Ended December 31, 2018 | ||||||||||||||||||||||||
| Private Passenger Auto | Non- Standard Auto | Home and Farm | Crop | All Other | Total | |||||||||||||||||||
| Direct premiums earned | $ | 65,457 | $ | 27,964 | $ | 70,355 | $ | 47,505 | $ | 8,319 | $ | 219,600 | ||||||||||||
| Assumed premiums earned | 16 | — | (17 | ) | 2,306 | 4,209 | 6,514 | |||||||||||||||||
| Ceded premiums earned | (3,008 | ) | — | (5,661 | ) | (21,112 | ) | (613 | ) | (30,394 | ) | |||||||||||||
| Net premiums earned | 62,465 | 27,964 | 64,677 | 28,699 | 11,915 | 195,720 | ||||||||||||||||||
| Direct losses and LAE | 44,644 | 14,338 | 42,993 | 14,206 | 3,713 | 119,894 | ||||||||||||||||||
| Assumed losses and LAE | 358 | — | (295 | ) | 696 | 2,640 | 3,399 | |||||||||||||||||
| Ceded losses and LAE | (478 | ) | — | 17 | (2,990 | ) | (754 | ) | (4,205 | ) | ||||||||||||||
| Net losses and LAE | 44,524 | 14,338 | 42,715 | 11,912 | 5,599 | 119,088 | ||||||||||||||||||
| Gross margin | 17,941 | 13,626 | 21,962 | 16,787 | 6,316 | 76,632 | ||||||||||||||||||
| Underwriting and general expenses | 18,530 | 10,126 | 19,950 | 3,176 | 2,928 | 54,710 | ||||||||||||||||||
| Underwriting gain (loss) | (589 | ) | 3,500 | 2,012 | 13,611 | 3,388 | 21,922 | |||||||||||||||||
| Fee and other income | 1,406 | 6,496 | ||||||||||||||||||||||
| 4,906 | ||||||||||||||||||||||||
| Net investment income | 6,180 | |||||||||||||||||||||||
| Net realized capital gain on investments | 3,974 | |||||||||||||||||||||||
| Income before income taxes | 38,572 | |||||||||||||||||||||||
| Income taxes | 7,328 | |||||||||||||||||||||||
| Net income | 31,244 | |||||||||||||||||||||||
| Net attributable to non-controlling interest | 163 | |||||||||||||||||||||||
| Net income attributable to NI Holdings, Inc. | $ | 31,081 | ||||||||||||||||||||||
| Non-GAAP Ratios: | ||||||||||||||||||||||||
| Loss and LAE ratio | 71.3% | 51.3% | 66.0% | 41.5% | 47.0% | 60.8% | ||||||||||||||||||
| Expense ratio | 29.7% | 36.2% | 30.8% | 11.1% | 24.6% | 28.0% | ||||||||||||||||||
| Combined ratio | 100.9% | 87.5% | 96.9% | 52.6% | 71.6% | 88.8% | ||||||||||||||||||
| Balances at December 31, 2018: | ||||||||||||||||||||||||
| Premiums and agents’ balances receivable | $ | 16,558 | $ | 7,769 | $ | 8,630 | $ | — | $ | 1,330 | $ | 34,287 | ||||||||||||
| Deferred policy acquisition costs | 3,658 | 3,364 | 5,279 | — | 565 | 12,866 | ||||||||||||||||||
| Reinsurance recoverables on losses | 176 | — | 730 | 384 | 942 | 2,232 | ||||||||||||||||||
| Receivable from Federal Crop Insurance Corporation | — | — | — | 16,169 | — | 16,169 | ||||||||||||||||||
| Goodwill and other intangibles | — | 4,623 | — | — | — | 4,623 | ||||||||||||||||||
| Unpaid losses and LAE | 18,154 | 46,786 | 10,732 | 2,126 | 9,323 | 87,121 | ||||||||||||||||||
| Unearned premiums | 26,022 | 17,177 | 36,883 | — | 4,685 | 84,767 | ||||||||||||||||||
100
| Year Ended December 31, 2017 | ||||||||||||||||||||||||
| Private Passenger Auto | Non- Standard Auto | Home and Farm | Crop | All Other | Total | |||||||||||||||||||
| Direct premiums earned | $ | 58,424 | $ | 10,530 | $ | 63,701 | $ | 49,012 | $ | 7,751 | $ | 189,418 | ||||||||||||
| Assumed premiums earned | 15 | — | (17 | ) | 2,524 | 4,189 | 6,711 | |||||||||||||||||
| Ceded premiums earned | (3,061 | ) | — | (5,289 | ) | (7,710 | ) | (605 | ) | (16,665 | ) | |||||||||||||
| Net premiums earned | 55,378 | 10,530 | 58,395 | 43,826 | 11,335 | 179,464 | ||||||||||||||||||
| Direct losses and LAE | 34,743 | 8,690 | 40,381 | 36,110 | 4,193 | 124,117 | ||||||||||||||||||
| Assumed losses and LAE | 279 | — | — | 1,654 | 4,244 | 6,177 | ||||||||||||||||||
| Ceded losses and LAE | (271 | ) | — | (672 | ) | (5,322 | ) | (1,318 | ) | (7,583 | ) | |||||||||||||
| Net losses and LAE | 34,751 | 8,690 | 39,709 | 32,442 | 7,119 | 122,711 | ||||||||||||||||||
| Gross margin | 20,627 | 1,840 | 18,686 | 11,384 | 4,216 | 56,753 | ||||||||||||||||||
| Underwriting and general expenses | 16,888 | 3,057 | 18,186 | 4,425 | 1,867 | 44,423 | ||||||||||||||||||
| Underwriting gain (loss) | 3,739 | (1,217 | ) | 500 | 6,959 | 2,349 | 12,330 | |||||||||||||||||
| Fee and other income | 1,087 | 1,648 | ||||||||||||||||||||||
| (130 | ) | |||||||||||||||||||||||
| Net investment income | 5,031 | |||||||||||||||||||||||
| Net realized capital gain on investments | 2,997 | |||||||||||||||||||||||
| Income before income taxes | 22,006 | |||||||||||||||||||||||
| Income taxes | 6,394 | |||||||||||||||||||||||
| Net income | 15,612 | |||||||||||||||||||||||
| Net (loss) attributable to non-controlling interest | (379 | ) | ||||||||||||||||||||||
| Net income attributable to NI Holdings, Inc. | $ | 15,991 | ||||||||||||||||||||||
| Non-GAAP Ratios: | ||||||||||||||||||||||||
| Loss and LAE ratio | 62.8% | 82.5% | 68.0% | 74.0% | 62.8% | 68.4% | ||||||||||||||||||
| Expense ratio | 30.5% | 29.0% | 31.1% | 10.1% | 16.5% | 24.8% | ||||||||||||||||||
| Combined ratio | 93.2% | 111.6% | 99.1% | 84.1% | 79.3% | 93.1% | ||||||||||||||||||
| Balances at December 31, 2017: | ||||||||||||||||||||||||
| Premiums and agents’ balances receivable | $ | 15,430 | $ | 1,196 | $ | 7,856 | $ | — | $ | 1,150 | $ | 25,632 | ||||||||||||
| Deferred policy acquisition costs | 3,404 | 306 | 4,638 | — | 511 | 8,859 | ||||||||||||||||||
| Reinsurance recoverables on losses | 690 | — | 1,449 | 133 | 1,856 | 4,128 | ||||||||||||||||||
| Receivable from Federal Crop Insurance Corporation | — | — | — | 10,501 | — | 10,501 | ||||||||||||||||||
| Goodwill and other intangibles | — | 2,628 | — | — | — | 2,628 | ||||||||||||||||||
| Unpaid losses and LAE | 17,805 | 5,810 | 10,510 | 1,152 | 10,613 | 45,890 | ||||||||||||||||||
| Unearned premiums | 24,442 | 1,762 | 32,691 | — | 4,367 | 63,262 | ||||||||||||||||||
101
| Year Ended December 31, 2016 | ||||||||||||||||||||||||
| Private Passenger Auto | Non- Standard Auto | Home and Farm | Crop | All Other | Total | |||||||||||||||||||
| Direct premiums earned | $ | 51,535 | $ | 10,671 | $ | 58,445 | $ | 48,876 | $ | 7,431 | $ | 176,958 | ||||||||||||
| Assumed premiums earned | 2 | — | 1 | 2,691 | 3,852 | 6,546 | ||||||||||||||||||
| Ceded premiums earned | (3,287 | ) | — | (8,203 | ) | (18,404 | ) | (854 | ) | (30,748 | ) | |||||||||||||
| Net premiums earned | 48,250 | 10,671 | 50,243 | 33,163 | 10,429 | 152,756 | ||||||||||||||||||
| Direct losses and LAE | 41,022 | 9,965 | 65,119 | 23,173 | 7,112 | 146,391 | ||||||||||||||||||
| Assumed losses and LAE | 316 | — | 634 | 766 | 3,231 | 4,947 | ||||||||||||||||||
| Ceded losses and LAE | (3,446 | ) | — | (21,749 | ) | (4,570 | ) | (3,065 | ) | (32,830 | ) | |||||||||||||
| Net losses and LAE | 37,892 | 9,965 | 44,004 | 19,369 | 7,278 | 118,508 | ||||||||||||||||||
| Gross margin | 10,358 | 706 | 6,239 | 13,794 | 3,151 | 34,248 | ||||||||||||||||||
| Underwriting and general expenses | 13,953 | 2,921 | 15,821 | 4,525 | 1,902 | 39,122 | ||||||||||||||||||
| Underwriting gain (loss) | (3,595 | ) | (2,215 | ) | (9,582 | ) | 9,269 | 1,249 | (4,874 | ) | ||||||||||||||
| Fee and other income | 1,157 | 1,666 | ||||||||||||||||||||||
| (1,058 | ) | |||||||||||||||||||||||
| Net investment income | 3,644 | |||||||||||||||||||||||
| Net realized capital gain on investments | 5,681 | |||||||||||||||||||||||
| Income before income taxes | 6,117 | |||||||||||||||||||||||
| Income taxes | 1,479 | |||||||||||||||||||||||
| Net income | 4,638 | |||||||||||||||||||||||
| Net income attributable to non-controlling interest | 87 | |||||||||||||||||||||||
| Net income attributable to NI Holdings, Inc. | $ | 4,551 | ||||||||||||||||||||||
| Non-GAAP Ratios: | ||||||||||||||||||||||||
| Loss and LAE ratio | 78.5% | 93.4% | 87.6% | 58.4% | 69.8% | 77.6% | ||||||||||||||||||
| Expense ratio | 28.9% | 27.4% | 31.5% | 13.6% | 18.2% | 25.6% | ||||||||||||||||||
| Combined ratio | 107.5% | 120.8% | 119.1% | 72.1% | 88.0% | 103.2% | ||||||||||||||||||
| Balances at December 31, 2016: | ||||||||||||||||||||||||
| Premiums and agents’ balances receivable | $ | 13,390 | $ | 906 | $ | 6,671 | $ | — | $ | 1,019 | $ | 21,986 | ||||||||||||
| Deferred policy acquisition costs | 3,412 | 232 | 4,998 | — | 300 | 8,942 | ||||||||||||||||||
| Reinsurance recoverables on losses | 1,042 | — | 3,845 | 579 | 1,726 | 7,192 | ||||||||||||||||||
| Receivable from Federal Crop Insurance Corporation | — | — | — | 16,761 | — | 16,761 | ||||||||||||||||||
| Goodwill and other intangibles | — | 2,628 | — | — | — | 2,628 | ||||||||||||||||||
| Unpaid losses and LAE | 24,713 | 5,933 | 15,483 | 4,270 | 9,233 | 59,632 | ||||||||||||||||||
| Unearned premiums | 22,119 | 1,457 | 29,777 | — | 4,092 | 57,445 | ||||||||||||||||||
102
For purposes of evaluating profitability of the non-standard auto segment, management combines the policy fees paid by the insured with the underwriting gain or loss as its primary measure. As a result, these fees are allocated to the non-standard auto segment (included in fee and other income) in the above tables. The remaining fee and other income amounts are not allocated to any segment, including the $4,578 gain realized on the bargain purchase of Direct Auto in 2018.
We do not assign or allocate all Consolidated Statement of Operations or Consolidated Balance Sheet line items to our operating segments. Those line items include investment income, net realized capital gain on investments, other income excluding non-standard auto insurance fees, and income taxes within the Consolidated Statement of Operations. For the Consolidated Balance Sheet, those items include cash and investments, property and equipment, other assets, accrued expenses, federal income taxes recoverable or payable, and equity.
103
22. Statutory Net Income, Capital and Surplus, and Dividend Restrictions
The following table presents selected information, as filed with insurance regulatory authorities, for our insurance subsidiaries as determined in accordance with accounting practices prescribed or permitted by such insurance regulatory authorities as of and for the years ended December 31, 2018, 2017 and 2016:
| 2018 | 2017 | 2016 | ||||||||||
| Nodak Insurance: | ||||||||||||
| Statutory capital and surplus | $ | 175,875 | $ | 156,545 | $ | 139,140 | ||||||
| Statutory unassigned surplus | 170,875 | 151,545 | 139,140 | |||||||||
| Statutory net income | 19,943 | 13,915 | 3,665 | |||||||||
| American West: | ||||||||||||
| Statutory capital and surplus | 13,889 | 12,409 | 11,801 | |||||||||
| Statutory unassigned surplus | 7,888 | 6,408 | 5,800 | |||||||||
| Statutory net income | 1,238 | 429 | 782 | |||||||||
| Primero: | ||||||||||||
| Statutory capital and surplus | 9,767 | 8,936 | 8,616 | |||||||||
| Statutory unassigned surplus (deficit) | 508 | (323 | ) | (643 | ) | |||||||
| Statutory net income (loss) | 1,061 | 208 | (324 | ) | ||||||||
| Battle Creek: | ||||||||||||
| Statutory capital and surplus | 6,052 | 5,873 | 5,735 | |||||||||
| Statutory unassigned surplus | 3,052 | 2,873 | 2,735 | |||||||||
| Statutory net income | 159 | 153 | 174 | |||||||||
| Direct Auto: | ||||||||||||
| Statutory capital and surplus | 19,146 | 12,057 | 9,754 | |||||||||
| Statutory unassigned surplus | 16,146 | 9,057 | 6,754 | |||||||||
| Statutory net income | 7,530 | 634 | 926 | |||||||||
State insurance laws require our insurance subsidiaries to maintain certain minimum capital and surplus amounts on a statutory basis. Our insurance subsidiaries are subject to regulations that restrict the payment of dividends from statutory surplus and may require prior approval from their domiciliary insurance regulatory authorities. Our insurance subsidiaries are also subject to risk-based capital (“RBC”) requirements that may further affect their ability to pay dividends. Our insurance subsidiaries statutory capital and surplus at December 31, 2018 and 2017 exceeded the amount of statutory capital and surplus necessary to satisfy regulatory requirements, including the RBC requirements, by a significant margin.
Amounts available for distribution in 2019 to Nodak Insurance as dividends from its insurance subsidiaries without prior approval of insurance regulatory authorities are $1,389 from American West and $977 from Primero. No dividends were paid to Nodak Insurance from either entity during the years ended December 31, 2018, 2017, or 2016.
The amount available for payment of dividends from Nodak Insurance to NI Holdings during 2019 without the prior approval of the North Dakota Insurance Department is $17,588 based upon the policyholders’ surplus of Nodak Insurance at December 31, 2018. Prior to its payment of any extraordinary dividend, Nodak Insurance will be required to provide notice of the dividend to the North Dakota Insurance Department. This notice must be provided to the North Dakota Insurance Department 30 days prior to the payment of an extraordinary dividend and 10 days prior to the payment of an ordinary dividend. The North Dakota Insurance Department has the power to limit or prohibit dividend payments if Nodak Insurance is in violation of any law or regulation. These restrictions or any subsequently imposed restrictions may affect our future liquidity. No dividends were declared or paid in the years ended December 31, 2018 or 2017.
The amount available for payment of dividends from Direct Auto to NI Holdings during 2019 without the prior approval of the Illinois Department of Insurance is $6,653 based upon the policyholders’ surplus of Direct Auto at December 31, 2018. Prior to its payment of any dividend, Direct Auto will be required to provide notice of the dividend to the Illinois Department of Insurance. This notice must be provided to the Illinois Department of Insurance within five business days following declaration of any dividend and no less than 30 days prior to the payment of an extraordinary dividend or 10 days prior to the payment of an ordinary dividend. The Illinois Department of Insurance has the power to limit or prohibit dividend payments if Direct Auto is in violation of any law or regulation. These restrictions or any subsequently imposed restrictions may affect our future liquidity. No dividends were declared or paid by Direct Auto during the year ended December 31, 2018.
104
23. Interim Financial Data (Unaudited)
The following table provides a summary of unaudited quarterly results for the periods presented. Earnings per share data is only available for the quarterly periods subsequent to the conversion and sale of stock.
| Year Ended December 31, 2018 | ||||||||||||||||
| First Quarter | Second Quarter | Third Quarter | Fourth Quarter | |||||||||||||
| Net premiums earned | $ | 36,112 | $ | 50,677 | $ | 54,136 | $ | 54,795 | ||||||||
| Net investment income | 1,369 | 1,523 | 1,629 | 1,659 | ||||||||||||
| Total revenues | 38,327 | 52,920 | 64,100 | 57,023 | ||||||||||||
| Total expenses | 30,726 | 52,523 | 52,194 | 38,355 | ||||||||||||
| Net income before non-controlling interest | 6,152 | 256 | 9,877 | 14,959 | ||||||||||||
| Basic earnings per common share | 0.27 | 0.01 | 0.44 | 0.67 | ||||||||||||
| Year Ended December 31, 2017 | ||||||||||||||||
| First Quarter | Second Quarter | Third Quarter | Fourth Quarter | |||||||||||||
| Net premiums earned | $ | 32,809 | $ | 45,653 | $ | 52,525 | $ | 48,477 | ||||||||
| Net investment income | 999 | 1,303 | 1,404 | 1,325 | ||||||||||||
| Total revenues | 34,771 | 47,616 | 56,566 | 50,187 | ||||||||||||
| Total expenses | 27,740 | 47,655 | 59,691 | 32,048 | ||||||||||||
| Net income (loss) before non-controlling interest | 4,749 | 117 | (2,693 | ) | 13,439 | |||||||||||
| Basic earnings per common share | 0.21 | 0.01 | (0.12 | ) | 0.62 | |||||||||||
| Year Ended December 31, 2016 | ||||||||||||||||
| First Quarter | Second Quarter | Third Quarter | Fourth Quarter | |||||||||||||
| Net premiums earned | $ | 30,115 | $ | 37,136 | $ | 52,639 | $ | 32,866 | ||||||||
| Net investment income | 982 | 1,032 | 820 | 810 | ||||||||||||
| Total revenues | 31,490 | 38,806 | 59,135 | 34,316 | ||||||||||||
| Total expenses | 21,788 | 41,472 | 61,696 | 32,674 | ||||||||||||
| Net income (loss) before non-controlling interest | 6,219 | (1,819 | ) | (999 | ) | 1,237 | ||||||||||
| Basic earnings per common share | n/a | n/a | n/a | n/a | ||||||||||||
24. Subsequent Events
We have evaluated subsequent events through March 13, 2019, the date these consolidated financial statements were available for issuance.
105
| Item 9. | Changes in and Disagreements with Accountants on Accounting and Financial Disclosure |
There have been no changes or disagreements with accountants on accounting and financial disclosure.
| Item 9A. | Controls and Procedures |
Evaluation of Disclosure Controls and Procedures
The Company’s Chief Executive Officer and Chief Financial Officer have reviewed and evaluated the effectiveness of the Company’s disclosure controls and procedures (as required by Exchange Act Rules 240.13a-15(b) and 15d-14(a)) as of December 31, 2018. Based on that evaluation, the Chief Executive Officer and Chief Financial Officer have concluded that the Company’s current disclosure controls and procedures are effective and timely, providing them with material information relating to the Company required to be disclosed in the reports the Company files or submits under the Exchange Act.
Evaluation of Internal Controls over Financial Reporting
Our management is responsible for establishing and maintaining adequate internal control over financial reporting, as that term is defined in Rule 13a-15(f) under the Exchange Act. Under the supervision and with the participation of our Chief Executive Officer and our Chief Financial Officer, our management has reviewed and evaluated the effectiveness of our internal control over financial reporting based on the framework and criteria established in Internal Control – Integrated Framework (2013) issued by the Committee of Sponsoring Organizations of the Treadway Commission (the “COSO Framework”). Based on our evaluation under the COSO Framework, the Chief Executive Officer and Chief Financial Officer have concluded that the Company’s current internal control over financial reporting is effective, and that our consolidated financial statements we include in this Form 10-K Report present fairly, in all material respects, our financial position, results of operations, and cash flows in conformity with accounting principles generally accepted in the United States of America.
Changes in Internal Controls
There have not been any changes in the Company’s internal control over financial reporting (as such term is defined in Rules 13a-15(f) and 15d-15(f) under the Exchange Act) during the year ended December 31, 2018, to which this report relates that have materially affected, or are reasonably likely to materially affect the Company’s internal control over financial reporting.
| Item 9B. | Other Information |
None.
106
| Item 10. | Directors, Executive Officers and Corporate Governance |
We incorporate the response to this Item 10 by reference to our proxy statement we will file with the SEC on or about April 11, 2019 relating to our Annual Meeting of Shareholders that we will hold on May 21, 2019 (our “Proxy Statement”).
We have posted a copy of our Code of Ethics and Business Conduct on the Governance Highlights page of the Corporate Governance section of our website, www.niholdingsinc.com, which you can access free of charge. Information contained on the website is not incorporated by reference in, or considered part of, this Form 10-K. We intend to disclose on our website any amendments to, or waivers from, our Code of Ethics and Business Conduct that are required to be disclosed by law or NASDAQ Listing Rules.
| Item 11. | Executive Compensation |
We incorporate the response to this Item 11 by reference to our Proxy Statement.
| Item 12. | Security Ownership of Certain Beneficial Owners and Management and Related Stockholder Matters |
We incorporate the response to this Item 12 by reference to our Proxy Statement.
| Item 13. | Certain Relationships and Related Transactions, and Director Independence |
We incorporate the response to this Item 13 by reference to our Proxy Statement.
| Item 14. | Principal Accountant Fees and Services |
We incorporate the response to this Item 14 by reference to our Proxy Statement.
107
| Item 15. | Exhibits and Financial Statement Schedules |
List of Financial Statements and Financial Statement Schedules
| (a) | The following documents are filed as a part of this report: |
| (1) | Financial Statements and |
| (2) | Financial Statement schedules required to be filed by Item 8 of this report. |
Schedule I Condensed financial information of registrant – NI Holdings, Inc.
All other financial schedules are not required under the related instructions, as they are inapplicable or the information has been included in the Consolidated Financial Statements, and therefore have been omitted.
| (3) | The following exhibits are required by Item 601 of Regulation S-K and are included as part of this Form 10-K: |
| 2.1 | Plan of Mutual Property and Casualty Insurance Company Conversion and Minority Offering of Nodak Mutual Insurance Company, dated as of January 21, 2016 (1) |
| 3.1 | Articles of Incorporation of NI Holdings, Inc. (1) |
| 3.2 | Bylaws of NI Holdings, Inc. (1) |
| 4.1 | Form of certificate evidencing shares of common stock of NI Holdings, Inc. (1) |
| 10.1 | 2016 NI Holdings, Inc. Equity Incentive Plan (1) |
| 10.2 | Nodak Mutual Insurance Company Nonqualified Deferred Compensation Plan (1) |
| 10.3# | Employment Agreement dated as of April 28, 2016, between Michael J. Alexander and Nodak Mutual Insurance Company and NI Holdings, Inc. (1) |
| 10.4# | Employment Agreement dated as of April 28, 2016, between Brian R. Doom and Nodak Mutual Insurance Company and NI Holdings, Inc. (1) |
| 10.5# | Employment Agreement dated as of April 28, 2016, between Patrick W. Duncan and Nodak Mutual Insurance Company and NI Holdings, Inc. (1) |
| 10.6 | Trademark License Agreement dated as of October 1, 2016 between North Dakota Farm Bureau and Nodak Mutual Insurance Company (1) |
| 10.9# | Nodak Mutual Insurance Company Cash Incentive Bonus Plan (3) |
| 10.10# | NI Holdings, Inc. Employee Stock Ownership Plan (1) |
| 10.11 | Affiliation Agreement dated as of December 30, 2010 between Nodak Mutual Insurance Company and Battle Creek Mutual Insurance Company (2) |
| 21.1 | Subsidiaries of NI Holdings, Inc. (1) |
| 23.1* | Consent of Mazars USA LLP |
108
| 32* | Certification of Principal Executive Officer and Principal Financial Officer Pursuant to 18 U.S.C. Section 1350, as Adopted Pursuant to Section 906 of the Sarbanes-Oxley Act of 2002. |
| 101.INS** | XBRL Instance Document |
| 101.SCH** | XBRL Taxonomy Extension Schema Linkbase Document |
| 101.CAL** | XBRL Taxonomy Extension Calculation Linkbase Document |
| 101.DEF** | XBRL Taxonomy Extension Definition Linkbase Document |
| 101.LAB** | XBRL Taxonomy Extension Label Linkbase Document |
| 101.PRE** | XBRL Taxonomy Extension Presentation Linkbase Document |
* Filed herewith.
** XBRL (Extensible Business Reporting Language) information is furnished and not filed or a part of a registration statement or prospectus for purposes of Sections 11 or 12 of the Securities Act of 1933, as amended, is deemed not filed for purposes of Section 18 of the Securities Exchange Act of 1934, as amended, and otherwise is not subject to liability under these sections.
# Management contract or compensatory plan or arrangement.
(1) Filed as an exhibit to the Company’s Registration Statement on Form S-1 (File No. 333-214057) filed with the SEC on October 11, 2016, and incorporated herein by reference.
(2) Filed as an exhibit to Amendment No. 1 to the Company’s Registration Statement on Form S-1 (File No. 333-214057) filed with the SEC on November 14, 2016, and incorporated herein by reference.
(3) Filed as an exhibit to Amendment No. 4 to the Company’s Registration Statement on Form S-1 (File No. 333-214057) filed with the SEC on January 12, 2017, and incorporated herein by reference.
| Item 16. | Form 10-K Summary |
None.
109
Schedule I – Condensed financial information of registrant – NI Holdings, Inc.
NI Holdings, Inc. was formed on March 13, 2017. The following condensed financial information begins with that date.
| Condensed Balance Sheets | ||||||||
| December 31, | ||||||||
| 2018 | 2017 | |||||||
| Assets: | ||||||||
| Cash and cash equivalents | $ | 5,886 | $ | 6,831 | ||||
| Fixed income securities, at fair value | 48,097 | 60,759 | ||||||
| Equity securities, at fair value | 11,607 | 18,458 | ||||||
| Total cash and investments | 65,590 | 86,048 | ||||||
| Accrued investment income | 311 | 464 | ||||||
| Investment in wholly-owned subsidiaries | 208,510 | 168,103 | ||||||
| Deferred income taxes, net | 458 | (236 | ) | |||||
| Total assets | $ | 274,869 | $ | 254,379 | ||||
| Liabilities: | ||||||||
| Accrued expenses and other liabilities | 2,105 | 2,260 | ||||||
| Federal income tax payable (recoverable) | 274 | (275 | ) | |||||
| Commitments and contingencies | — | — | ||||||
| Total liabilities | 2,379 | 1,985 | ||||||
| Shareholders’ equity | 272,490 | 252,394 | ||||||
| Total liabilities and equity | $ | 274,869 | $ | 254,379 | ||||
| Condensed Statements of Operations | ||||||||
| Year Ended December 31, | ||||||||
| 2018 | 2017 | |||||||
| Revenues: | ||||||||
| Fee and other income | $ | 4,580 | $ | 19 | ||||
| Net investment income | 1,481 | 916 | ||||||
| Net realized capital gain on investments | 1,190 | 330 | ||||||
| Total revenues | 7,251 | 1,265 | ||||||
| Expenses: | ||||||||
| Other underwriting and general expenses | 2,574 | 2,068 | ||||||
| Total expenses | 2,574 | 2,068 | ||||||
| Income (loss) before income taxes and equity in undistributed net income of subsidiaries | 4,677 | (803 | ) | |||||
| Income tax expense (benefit) | 98 | (572 | ) | |||||
| Income (loss) before equity in undistributed net income of subsidiaries | 4,579 | (231 | ) | |||||
| Equity in undistributed net income of subsidiaries | 26,502 | 16,222 | ||||||
| Net income attributable to NI Holdings, Inc. | $ | 31,081 | $ | 15,991 | ||||
| Condensed Statements of Comprehensive Income | ||||||||
| Year Ended December 31, | ||||||||
| 2018 | 2017 | |||||||
| Net income attributable to NI Holdings, Inc. | $ | 31,081 | $ | 15,991 | ||||
| Other comprehensive income, net of income taxes: | ||||||||
| Unrealized (loss) gain on investments | (745 | ) | 990 | |||||
| Unrealized (loss) gain on subsidiaries | (8,877 | ) | 1,986 | |||||
| Other comprehensive (loss) income, net of income taxes | (9,622 | ) | 2,976 | |||||
| Comprehensive income | $ | 21,459 | $ | 18,967 | ||||
110
| Condensed Statements of Cash Flows | ||||||||
| Year Ended December 31, | ||||||||
| 2018 | 2017 | |||||||
| Cash flows from operating activities: | ||||||||
| Net income attributable to NI Holdings, Inc. | $ | 31,081 | $ | 15,991 | ||||
| Adjustments: | ||||||||
| Equity in undistributed net income of subsidiaries | (26,502 | ) | (16,222 | ) | ||||
| Gain on acquisition of Direct Auto Insurance Company | (4,578 | ) | — | |||||
| Other | 1,109 | 2,072 | ||||||
| Net adjustments | (29,971 | ) | (14,150 | ) | ||||
| Net cash provided by operating activities | 1,110 | 1,841 | ||||||
| Cash flows from investing activities: | ||||||||
| Net sale (purchase) of fixed income and equity securities | 17,941 | (77,718 | ) | |||||
| Acquisition of Direct Auto Insurance Company | (17,000 | ) | — | |||||
| Net cash provided by (used in) investing activities | 941 | (77,718 | ) | |||||
| Cash flows from financing activities: | ||||||||
| Proceeds from issuance of common stock | — | 93,145 | ||||||
| Purchase of treasury stock | (2,996 | ) | (8,037 | ) | ||||
| Loan to employee stock ownership plan | — | (2,400 | ) | |||||
| Net cash flows (used in) provided by financing activities | (2,996 | ) | 82,708 | |||||
| Net (decrease) increase in cash and cash equivalents | (945 | ) | 6,831 | |||||
| Cash and cash equivalents at beginning of period | 6,831 | — | ||||||
| Cash and cash equivalents at end of period | $ | 5,886 | $ | 6,831 | ||||
Note A – Basis of presentation
In the parent-company-only financial statements, the Company’s investment in subsidiaries is stated at cost plus equity in undistributed earnings of subsidiaries since inception. The parent-company-only financial statements should be read in conjunction with the Company’s Consolidated Financial Statements.
Note B – Dividends from subsidiaries
The Company has received no dividends
from its subsidiaries since being formed on March 13, 2017.
111
SIGNATURES
Pursuant to the requirements of Section 13 or 15(d) of the Securities Exchange Act of 1934, the Registrant has duly caused this report to be signed on its behalf by the undersigned, thereunto duly authorized on March 13, 2019.
| NI HOLDINGS, INC. | |
| /s/ Michael J. Alexander | |
| Michael J. Alexander | |
| President and Chief Executive Officer | |
| (Principal Executive Officer) | |
Pursuant to the requirements of the Securities Exchange Act of 1934, this report has been signed below on March 13, 2019, by the following persons on behalf of the registrant and in the capacities indicated.
| Signature | Capacity | Date | ||
| /s/ Michael J. Alexander | President and Chief Executive Officer (Principal Executive Officer), Director |
March 13, 2019 | ||
| Michael J. Alexander | ||||
| /s/ Brian R. Doom | Chief Financial Officer (Principal Financial and Accounting Officer) |
March 13, 2019 | ||
| Brian R. Doom | ||||
| /s/ Eric K. Aasmundstad | Director | March 13, 2019 | ||
| Eric K. Aasmundstad | ||||
| /s/ William R. Devlin | Director | March 13, 2019 | ||
| William R. Devlin | ||||
| /s/ Duaine C. Espegard | Director | March 13, 2019 | ||
| Duaine C. Espegard | ||||
| /s/ Stephen V. Marlow | Director | March 13, 2019 | ||
| Stephen V. Marlow | ||||
| /s/ Jeffrey R. Missling | Director | March 13, 2019 | ||
| Jeffrey R. Missling | ||||
112
Exhibit 23.1
CONSENT OF INDEPENDENT REGISTERED PUBLIC ACCOUNTING FIRM
We consent to the incorporation by reference in the Registration Statement on Form S-8 (No. 333-221630) under the Securities Act of 1933 of the NI Holdings, Inc. 2017 Stock and Incentive Plan of our report dated March 13, 2019 on the consolidated balance sheets of NI Holdings, Inc. and Subsidiaries as of December 31, 2018 and 2017, and the related consolidated statements of operations, comprehensive income, changes in equity, and cash flows for each of the three years in the period ended December 31, 2018, and the related notes and the schedule listed in Item 15(a)(2). This report appears in the December 31, 2018 Annual Report on Form 10-K of NI Holdings, Inc. and Subsidiaries.
/s/ Mazars USA LLP
Fort Washington, PA
March 13, 2019
113
Exhibit 31.1
CERTIFICATION OF PERIODIC REPORT UNDER
SECTION 302 OF THE
SARBANES-OXLEY ACT OF 2002
I, Michael J. Alexander, certify that:
| 1. | I have reviewed this annual report on Form 10-K of NI Holdings, Inc. |
| 2. | Based on my knowledge, this report does not contain any untrue statement of a material fact or omit to state a material fact necessary to make the statements made, in light of the circumstances under which such statements were made, not misleading with respect to the period covered by this report; |
| 3. | Based on my knowledge, the financial statements, and other financial information included in this report, fairly present in all material respects the financial condition, results of operations and cash flows of the registrant as of, and for, the periods presented in this report; |
| 4. | The registrant’s other certifying officer and I are responsible for establishing and maintaining disclosure controls and procedures (as defined in Exchange Act Rules 13a-15(e) and 15d-15(e)) and internal control over financial reporting (as defined in Exchange Act Rules 13a-15(f) and 15d-15(f)) for the registrant and have: |
| (a) | Designed such disclosure controls and procedures, or caused such disclosure controls and procedures to be designed under our supervision, to ensure that material information relating to the registrant, including its consolidated subsidiaries, is made known to us by others within those entities, particularly during the period in which this report is being prepared; |
| (b) | Designed such internal control over financial reporting, or caused such internal control over financial reporting to be designed under our supervision, to provide reasonable assurance regarding the reliability of financial reporting and the preparation of financial statements for external purposes in accordance with generally accepted accounting principles; |
| (c) | Evaluated the effectiveness of the registrant’s disclosure controls and procedures and presented in this report our conclusions about the effectiveness of the disclosure controls and procedures, as of the end of the period covered by this report based on such evaluation; and |
| (d) | Disclosed in this report any change in the registrant’s internal control over financial reporting that occurred during the registrant’s most recent fiscal quarter (the registrant’s fourth fiscal quarter in the case of an annual report) that has materially affected, or is reasonably likely to materially affect, the registrant’s internal control over financial reporting; and |
| 5. | The registrant’s other certifying officer and I have disclosed, based on our most recent evaluation of internal control over financial reporting, to the registrant’s auditors and the audit committee of the registrant’s board of directors (or persons performing the equivalent functions): |
| (a) | All significant deficiencies and material weaknesses in the design or operation of internal control over financial reporting which are reasonably likely to adversely affect the registrant’s ability to record, process, summarize and report financial information; and |
| (b) | Any fraud, whether or not material, that involves management or other employees who have a significant role in the registrant’s internal control over financial reporting. |
| March 13, 2019 | /s/ Michael J. Alexander | |
| Michael J. Alexander | ||
| President and Chief Executive Officer | ||
| (Principal Executive Officer) |
114
Exhibit 31.2
CERTIFICATION OF PERIODIC REPORT UNDER
SECTION 302 OF THE
SARBANES-OXLEY ACT OF 2002
I, Brian R. Doom, certify that:
| 1. | I have reviewed this annual report on Form 10-K of NI Holdings, Inc. |
| 2. | Based on my knowledge, this report does not contain any untrue statement of a material fact or omit to state a material fact necessary to make the statements made, in light of the circumstances under which such statements were made, not misleading with respect to the period covered by this report; |
| 3. | Based on my knowledge, the financial statements, and other financial information included in this report, fairly present in all material respects the financial condition, results of operations and cash flows of the registrant as of, and for, the periods presented in this report; |
| 4. | The registrant’s other certifying officer and I are responsible for establishing and maintaining disclosure controls and procedures (as defined in Exchange Act Rules 13a-15(e) and 15d-15(e)) and internal control over financial reporting (as defined in Exchange Act Rules 13a-15(f) and 15d-15(f)) for the registrant and have: |
| (a) | Designed such disclosure controls and procedures, or caused such disclosure controls and procedures to be designed under our supervision, to ensure that material information relating to the registrant, including its consolidated subsidiaries, is made known to us by others within those entities, particularly during the period in which this report is being prepared; |
| (b) | Designed such internal control over financial reporting, or caused such internal control over financial reporting to be designed under our supervision, to provide reasonable assurance regarding the reliability of financial reporting and the preparation of financial statements for external purposes in accordance with generally accepted accounting principles; |
| (c) | Evaluated the effectiveness of the registrant’s disclosure controls and procedures and presented in this report our conclusions about the effectiveness of the disclosure controls and procedures, as of the end of the period covered by this report based on such evaluation; and |
| (d) | Disclosed in this report any change in the registrant’s internal control over financial reporting that occurred during the registrant’s most recent fiscal quarter (the registrant’s fourth fiscal quarter in the case of an annual report) that has materially affected, or is reasonably likely to materially affect, the registrant’s internal control over financial reporting; and |
| 5. | The registrant’s other certifying officer and I have disclosed, based on our most recent evaluation of internal control over financial reporting, to the registrant’s auditors and the audit committee of the registrant’s board of directors (or persons performing the equivalent functions): |
| (a) | All significant deficiencies and material weaknesses in the design or operation of internal control over financial reporting which are reasonably likely to adversely affect the registrant’s ability to record, process, summarize and report financial information; and |
| (b) | Any fraud, whether or not material, that involves management or other employees who have a significant role in the registrant’s internal control over financial reporting. |
| March 13, 2019 | /s/ Brian R. Doom | |
| Brian R. Doom | ||
| Chief Financial Officer | ||
| (Principal Financial Officer) |
115
Exhibit 32
CERTIFICATION PURSUANT TO
18 U.S.C. SECTION 1350,
AS ADOPTED PURSUANT TO
SECTION 906 OF THE SARBANES-OXLEY ACT OF 2002
In connection with the annual report of NI Holdings, Inc. (the “Company”) on Form 10-K for the period ended December 31, 2018, as filed with the Securities and Exchange Commission on the date hereof (the “Report”), we, Michael J. Alexander, President and Chief Executive Officer, and Brian R. Doom, Chief Financial Officer, of the Company, certify, pursuant to 18 U.S.C. Section 1350, as adopted pursuant to Section 906 of the Sarbanes-Oxley Act of 2002, that, to our knowledge:
| (1) | The Report fully complies with the requirements of Section 13(a) or 15(d) of the Securities Exchange Act of 1934; and |
| (2) | The information contained in the Report fairly presents, in all material respects, the financial condition and results of operations of the Company. |
| March 13, 2019 | /s/ Michael J. Alexander | |
| Michael J. Alexander | ||
| President and Chief Executive Officer | ||
| (Principal Executive Officer) | ||
| March 13, 2019 | /s/ Brian R. Doom | |
| Brian R. Doom | ||
| Chief Financial Officer | ||
| (Principal Financial Officer) |
116